The Windows battery report, without the command line
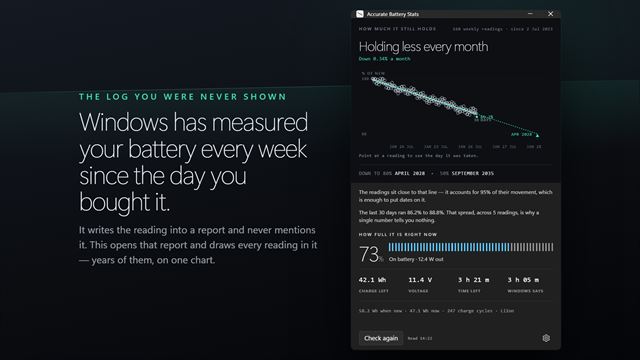
Windows already keeps a battery report. Type powercfg /batteryreport into a terminal and it writes an HTML page full of tables: design capacity, full charge capacity, cycle count and a long capacity history. The numbers are all there, but working out what they mean for your laptop is left to you.
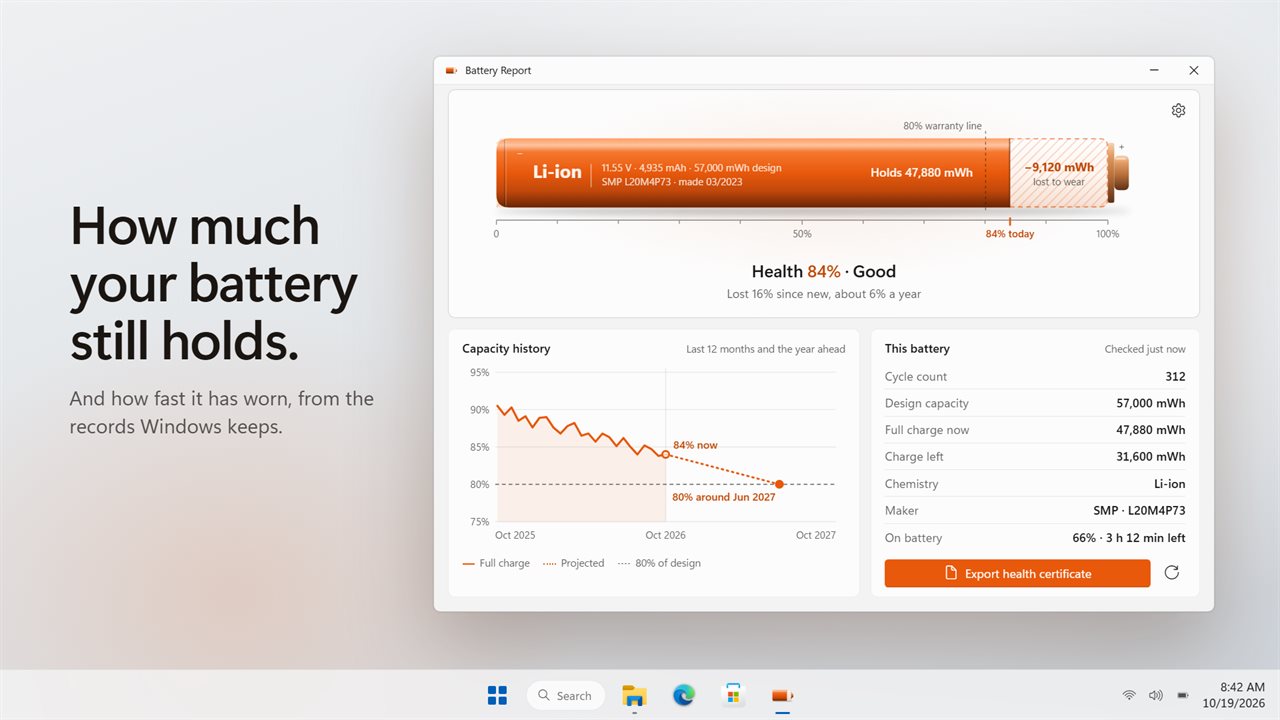
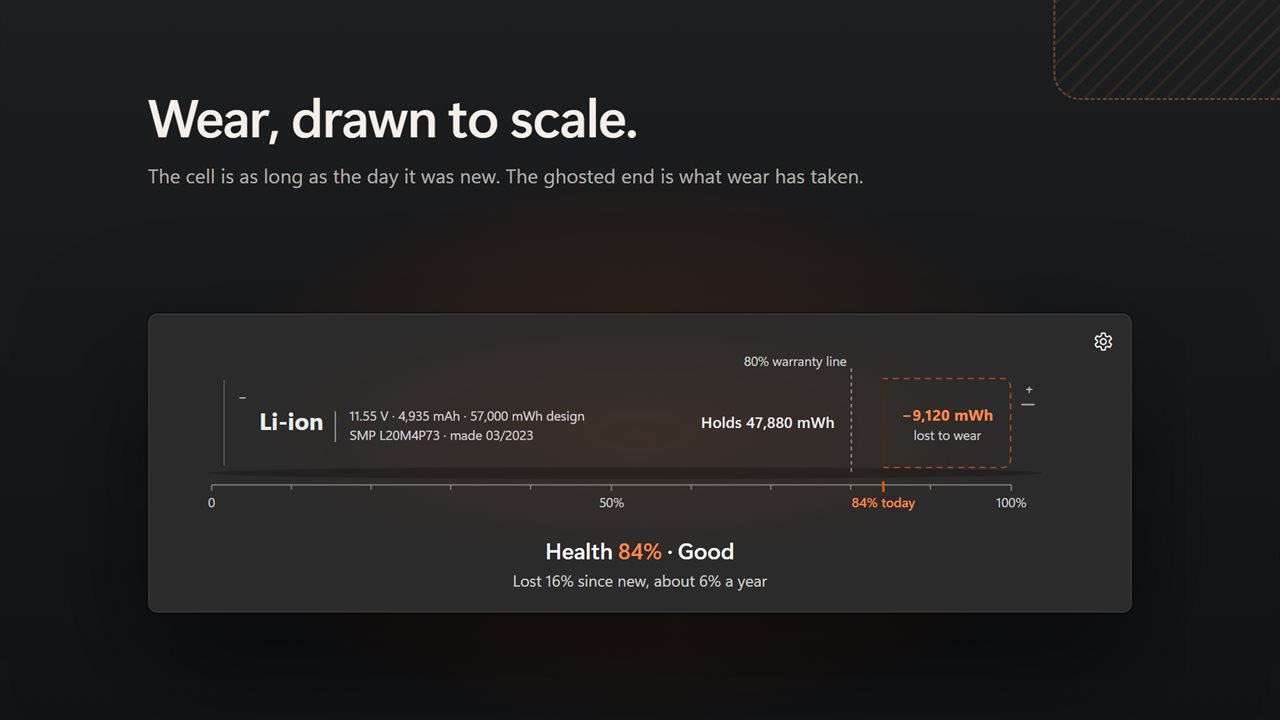
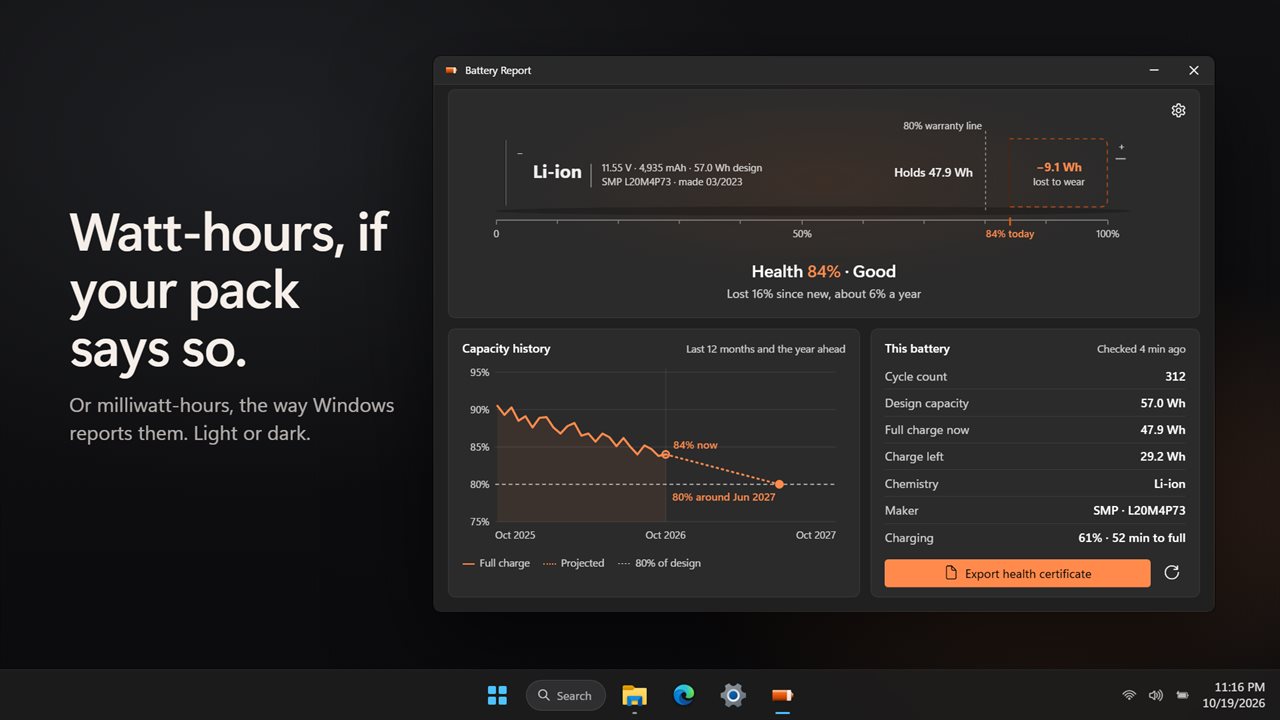
Battery Report reads that same log, plus the battery's own controller, and does the arithmetic. The top of the window shows one figure, health, which is what the battery holds at full charge today divided by what it was designed to hold. Beside it is a grade and a plain line such as how many percent it has lost since new and about how much it loses a year.
The battery itself is drawn as a long cell sized to its original capacity. The filled part is what remains; the faded end shows the capacity worn away, labeled in capacity units, with a marker at the 80% line many warranties use.
How to check laptop battery health in Windows 11
Open the app on a laptop or tablet and it reads the battery straight away. Charge level, power state and time left update every five seconds. The capacity history comes from powercfg, which takes a few seconds, so it is cached and read again at launch only once the last read is more than 12 hours old. Click Refresh to read it on demand.
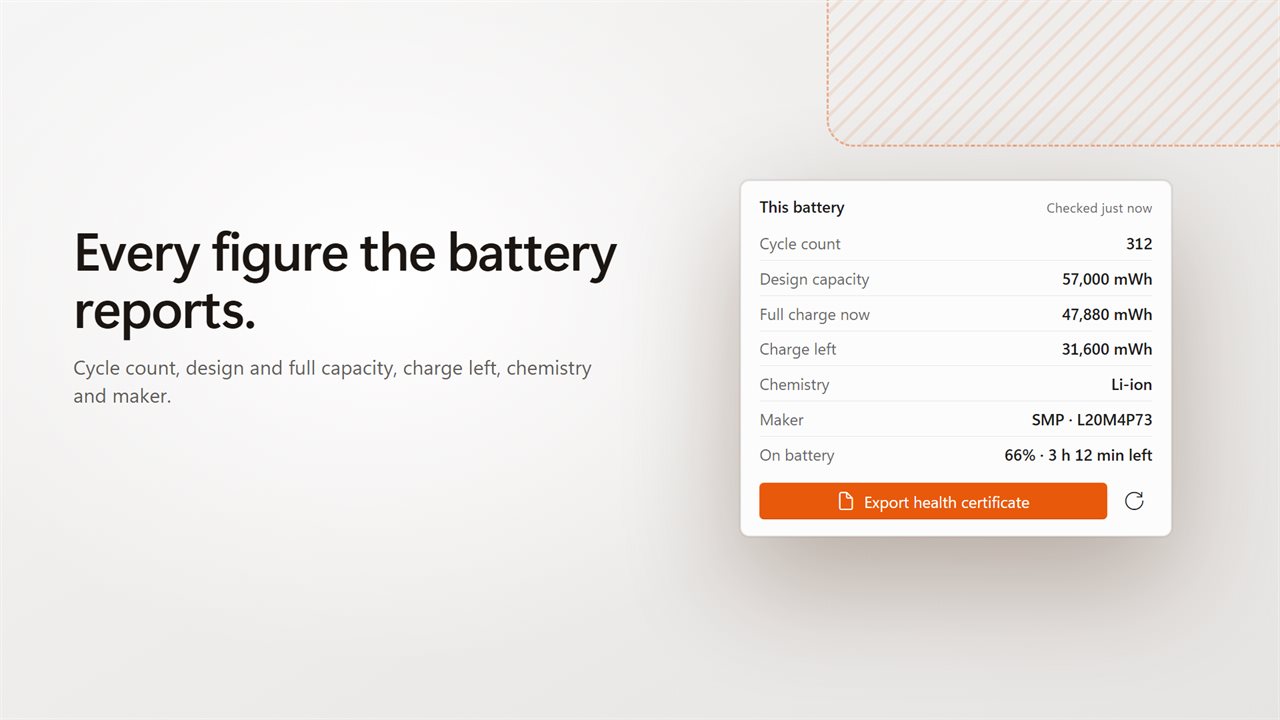
The panel titled This battery lists the details people usually hunt for in the HTML report:
- Cycle count, when the battery reports one
- Design capacity and Full charge now, side by side
- Charge left, and whether it is On battery, Charging or Plugged in, plus the estimated minutes remaining or until full
- Chemistry, such as Li-ion or Li-polymer, and the maker
- Capacity in milliwatt-hours, or in watt-hours to match the label printed on many packs
Design capacity vs full charge capacity, and what the gap means
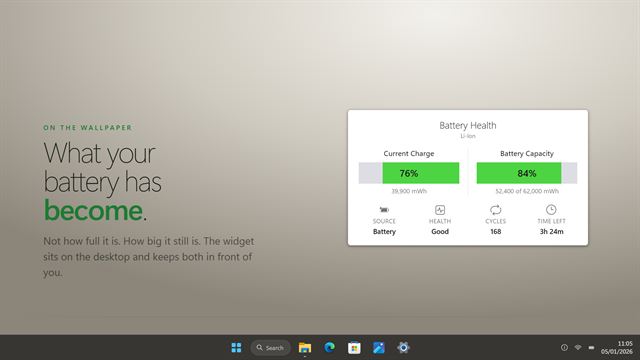
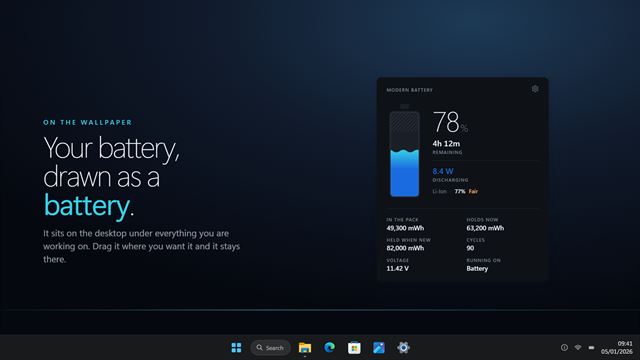
Design capacity is what the battery was built to hold. Full charge capacity is what it actually reaches today, and it shrinks a little with every month of use. The ratio between them is battery health. A battery at 100% holds everything it was made for; one at 75% runs about a quarter shorter on a charge than it did new.
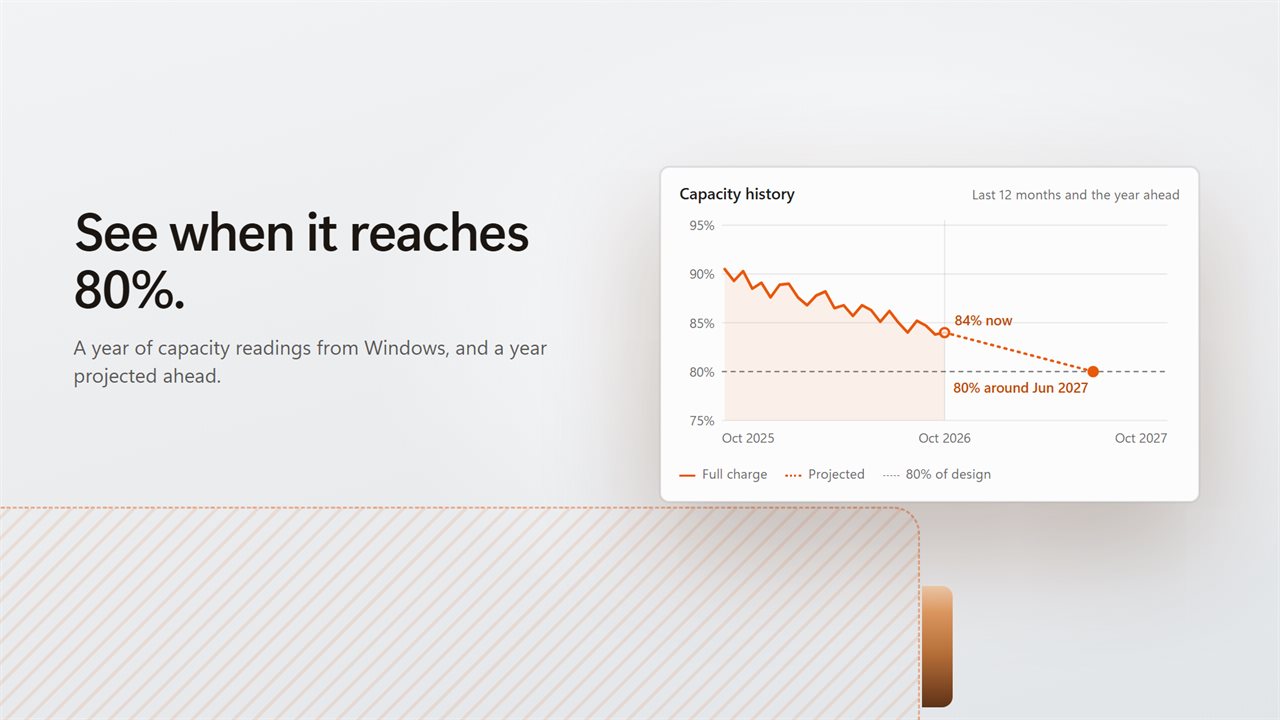
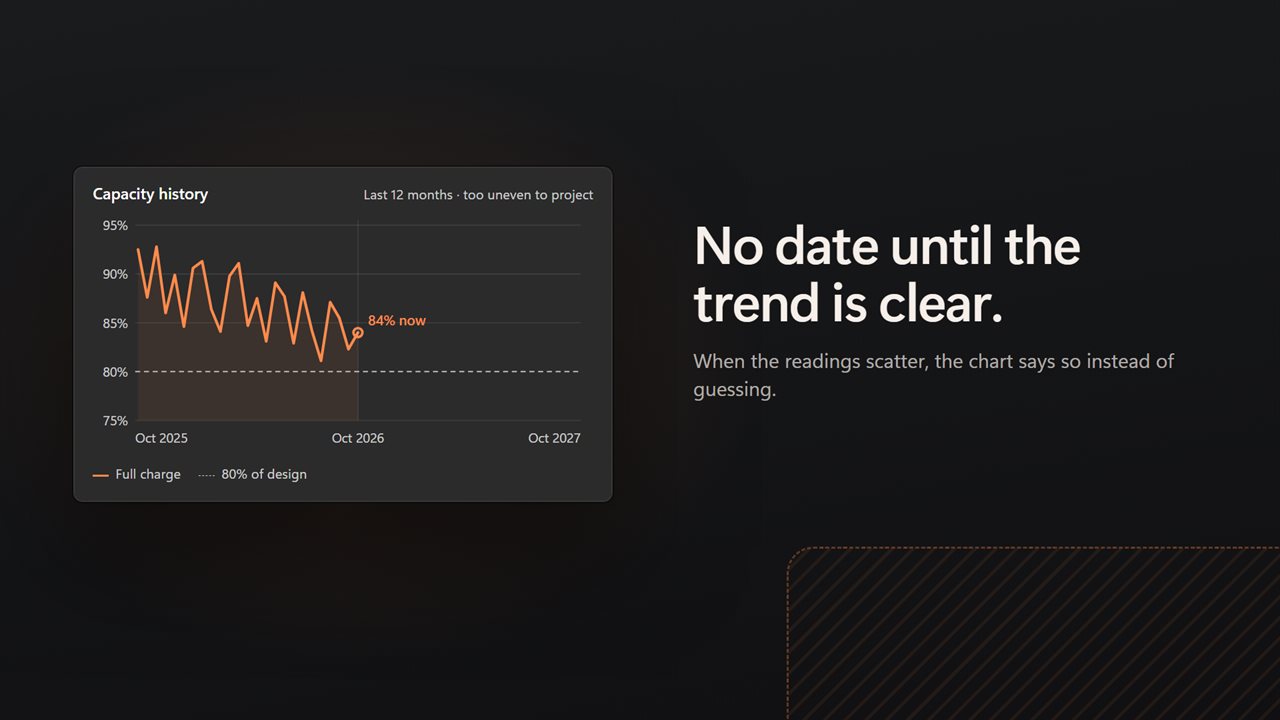
One reading on its own can jump around, so the Capacity history chart plots the past 12 months of weekly entries from the Windows log. The app fits a least-squares trend through those readings. Once there are at least eight of them on a reasonably steady downward line, and 80% falls inside the next year, it marks the month it expects the battery to cross it. If the readings are scattered, or the battery is not wearing down, the chart labels the span that way and gives no date.
A battery health report you can hand to someone
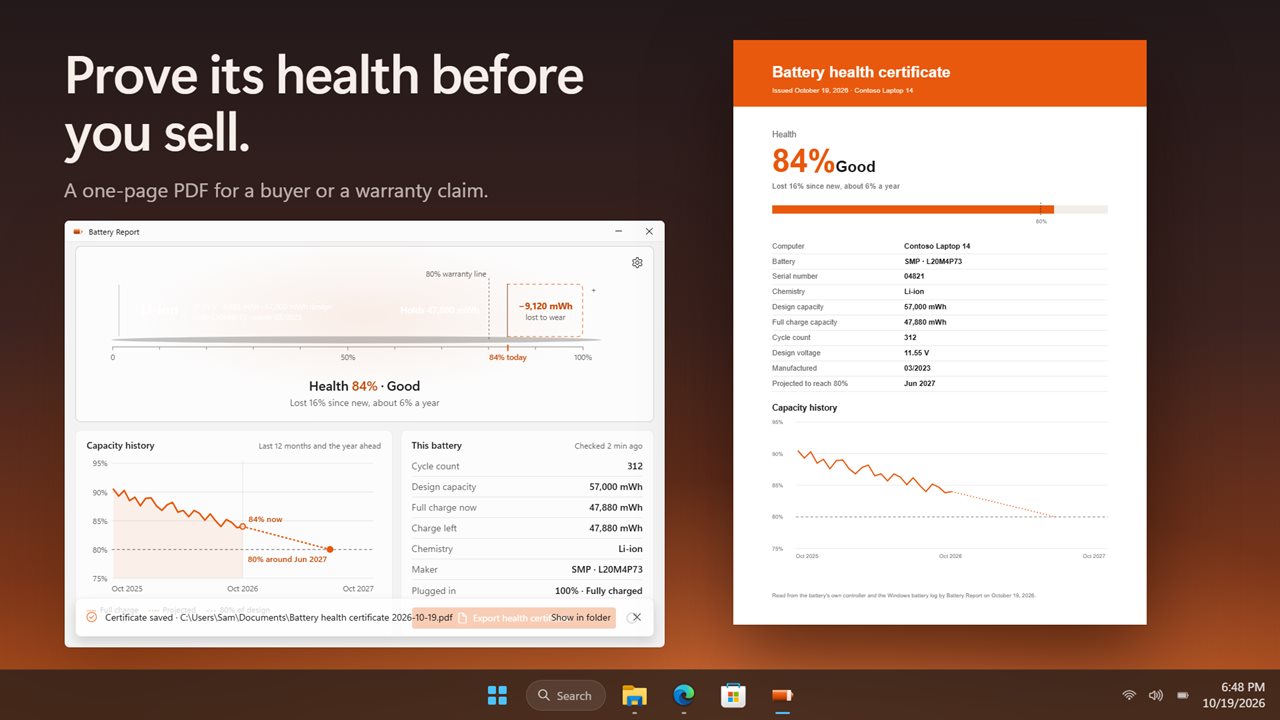
Click Export health certificate, or click the battery cell itself, and choose where to save a one-page PDF. It is dated, names the computer, and carries the battery's figures and the capacity chart. That is useful proof when you sell a used laptop, ask for a warranty replacement, or log the state of a fleet of machines before they are reassigned.
On a desktop or a virtual machine with no battery, the window simply says No battery in this PC.