Traceroute on Windows, drawn instead of printed
A traceroute on Windows normally means opening a terminal, typing the tracert command and reading a column of milliseconds that scrolls past as it runs. It works, but finding the hop where things go wrong means comparing numbers line by line.
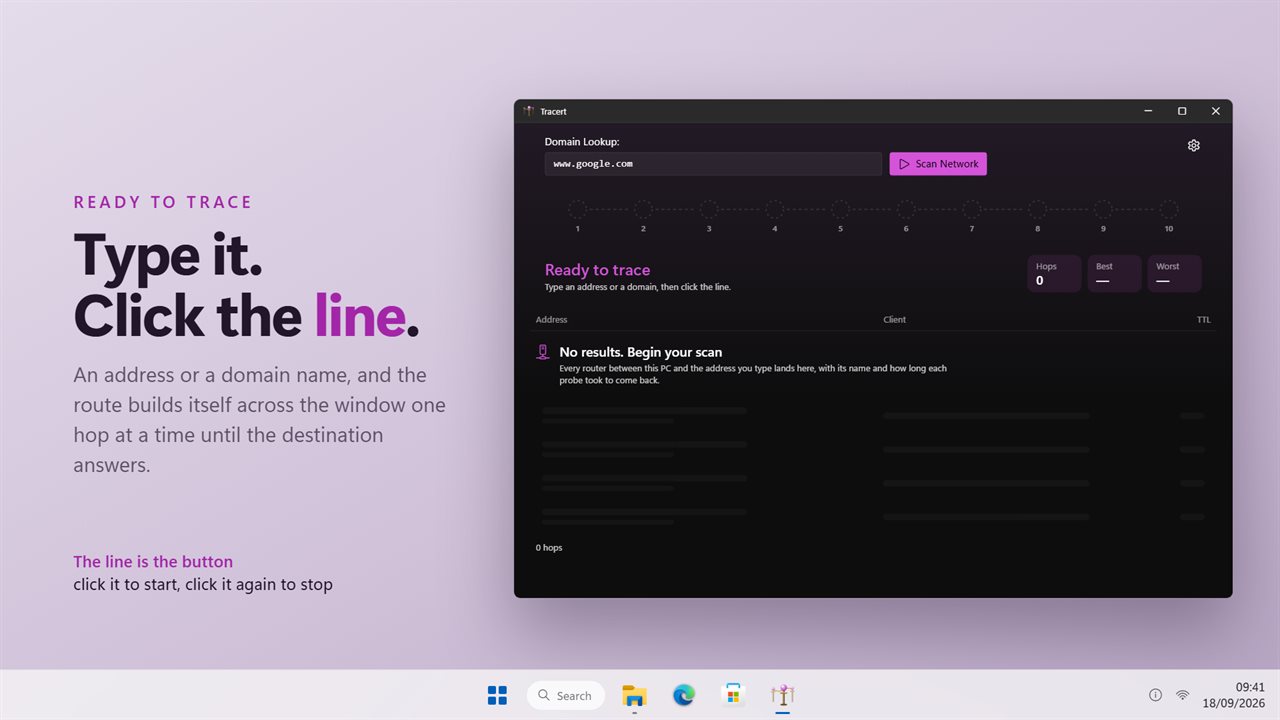
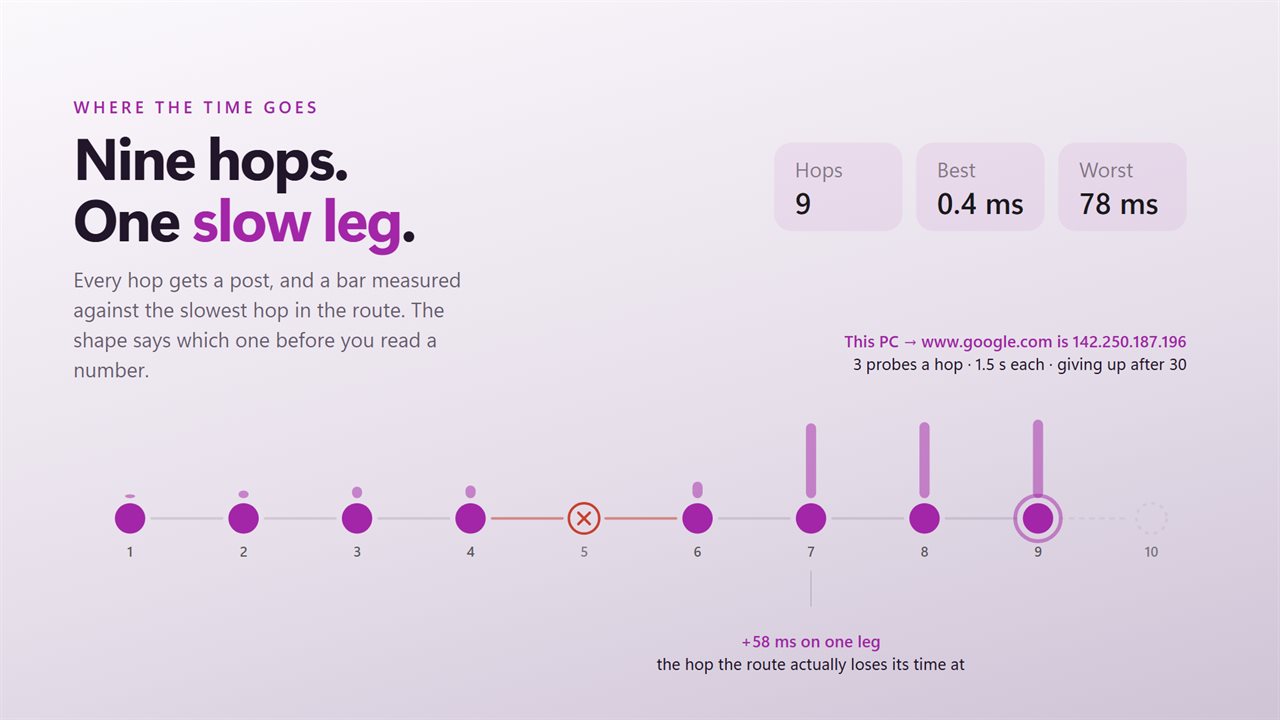
Tracert, the app, runs the same kind of trace and draws it. Type an IP address or a domain name, then click the line in the middle of the window. Each router that answers adds a post to the line, with a bar above it scaled against the slowest hop on the route. A route with a single tall bar has a single trouble spot, and you can see it at a glance.
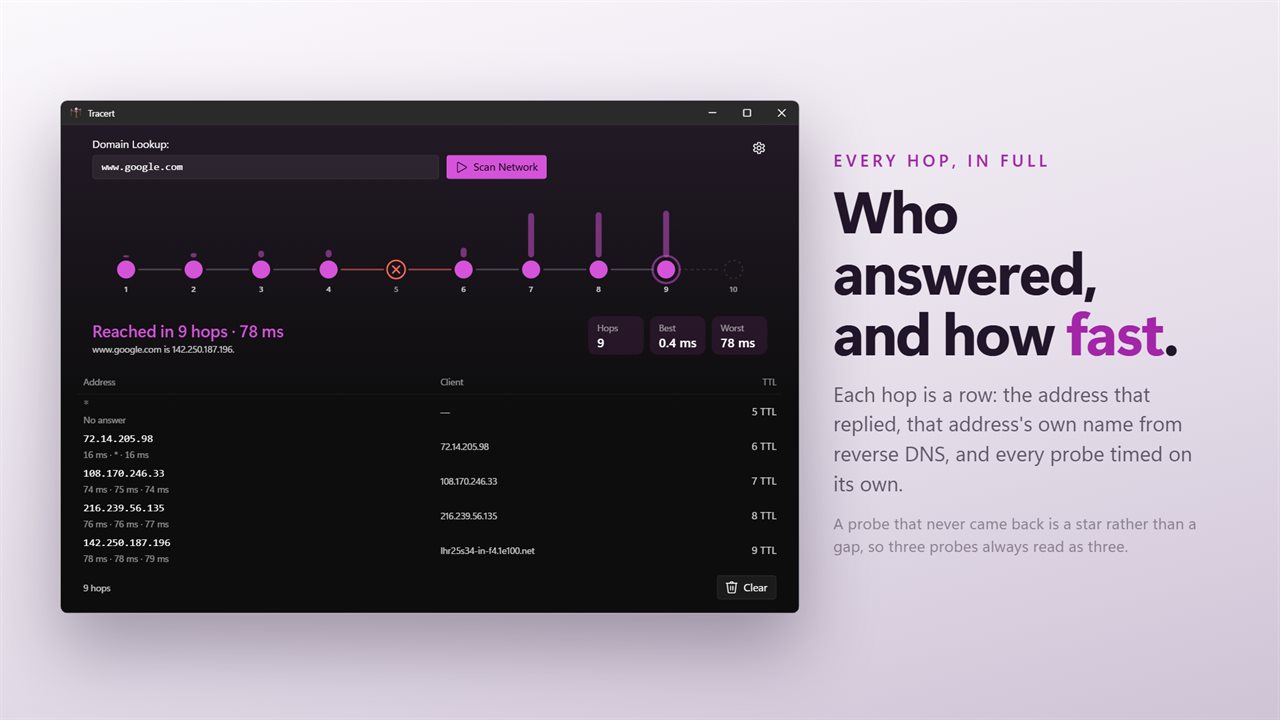
Below the line, each hop gets a row: the address that answered, its reverse DNS name if it has one, and the time of every probe listed separately. Running totals for Hops, Best and Worst update as the trace goes.
How traceroute works
Every packet carries a time-to-live counter that each router decrements. When it reaches zero, the router throws the packet away and sends back a short message saying so. A traceroute exploits this by sending probes with a TTL of 1, then 2, then 3, so each router along the path reveals itself in turn, until the destination itself replies.
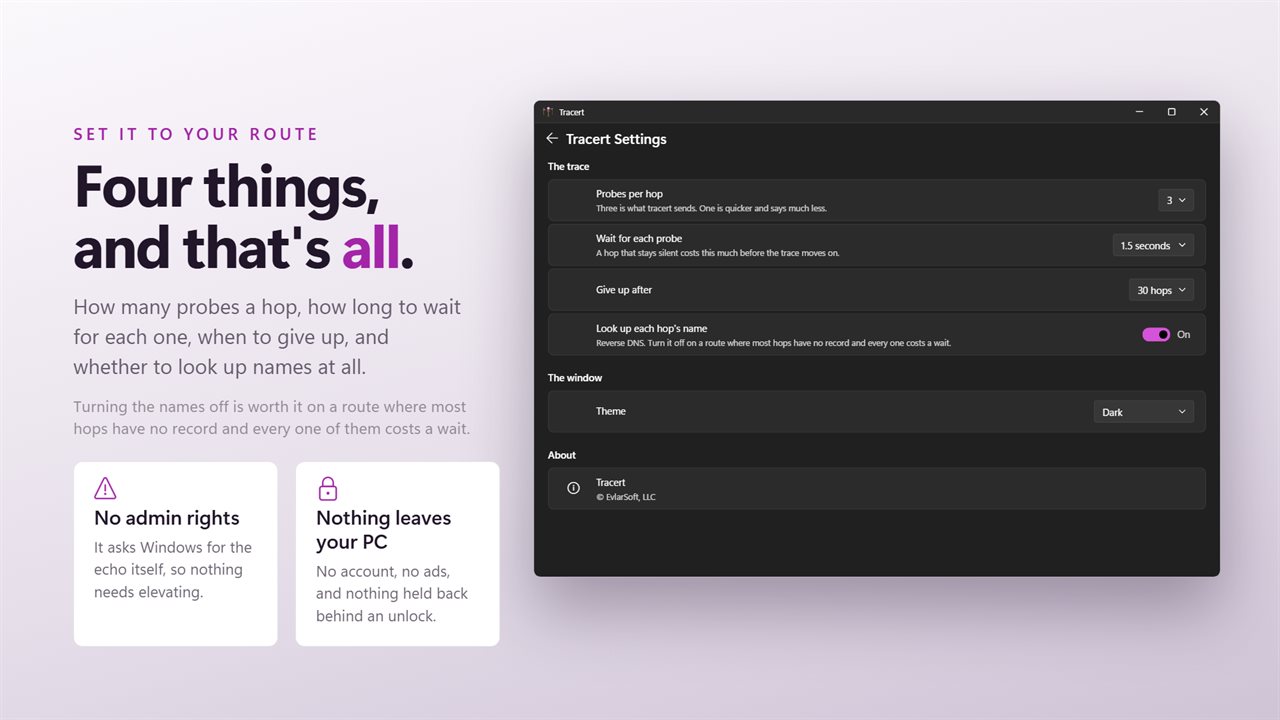
This app sends ICMP echo probes through the Windows networking API, the same kind the built-in command uses, so it does not need to run as administrator. It traces IPv4 routes.
How to read traceroute results
- Look for the first hop where the bar jumps and stays high for every hop after it. That is usually where the delay is introduced.
- A single tall bar in the middle, with normal bars after it, usually means that router is slow to answer traceroute probes, not that it is slowing your traffic.
- Hops one and two are normally your own router and your provider's first device. Large times there point at your local network or line.
- A big step on a long-distance hop, such as crossing an ocean, is physics rather than a fault.
Request timed out: what the stars mean
When a probe gets no reply within the wait you set, its slot shows a star rather than a time. A hop where every probe failed reads No answer. Many routers are configured to ignore these probes, so a silent hop in the middle of an otherwise healthy route is normal. Stars that start at one hop and continue to the end are the worrying pattern, because they suggest traffic is not getting past that point.
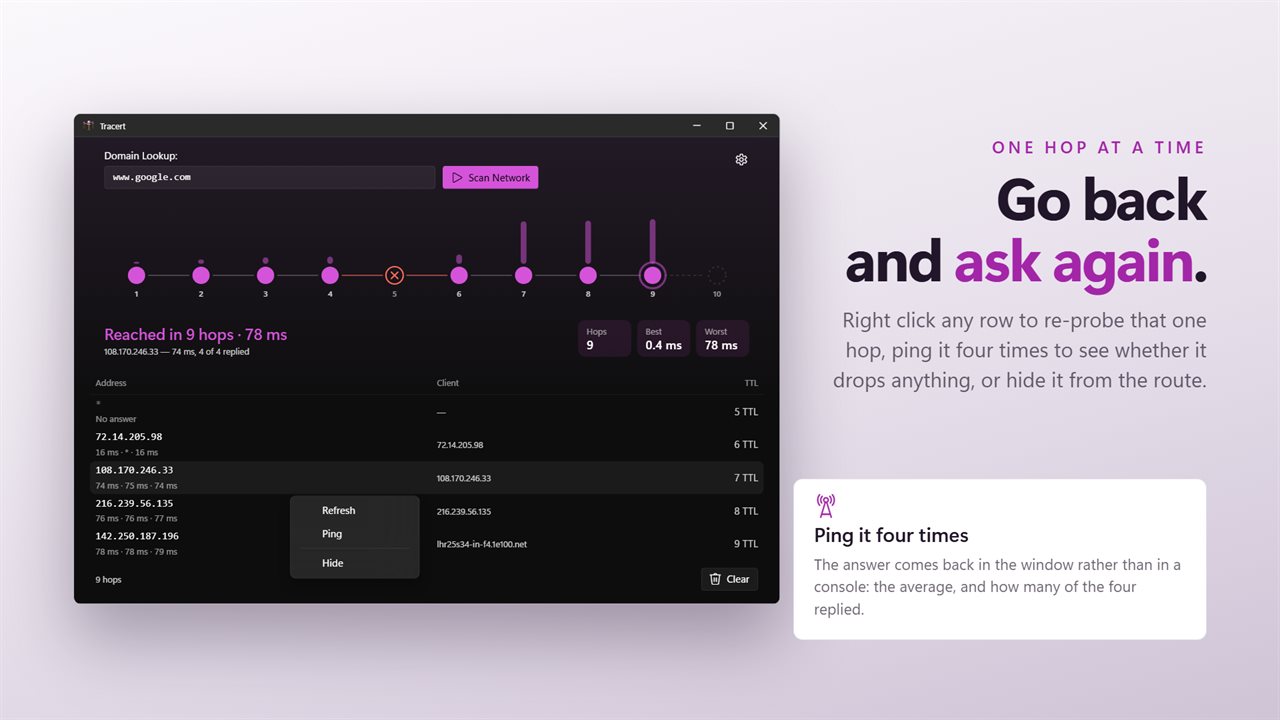
To dig into one hop, right-click its row and choose Ping. Four pings report whether replies were dropped and the fastest, average and slowest times. Refresh probes that hop again, and Hide removes a row you do not need.
Traceroute vs ping, and tuning the trace
Ping tells you whether one destination answers and how long it takes. A traceroute tells you the path and where along it the time is spent. Use ping to confirm there is a problem and the trace to locate it.
In Settings you can change Probes per hop (1 to 4), Wait for each probe, Give up after a hop limit, and Look up each hop's name. Turning name lookups off is worthwhile on routes where most routers have no reverse DNS record, since each failed lookup costs time. Click the line during a run to stop; the trace halts between probes rather than finishing the route first.