EEvlarSoft

CPU Core Load Reporter

A CPU monitor that shows every thread of your processor at a glance, which one is busiest, and which programs are keeping it busy.

Buy for $2.49
One payment. No subscription.
14-day money-back guarantee.
4.1
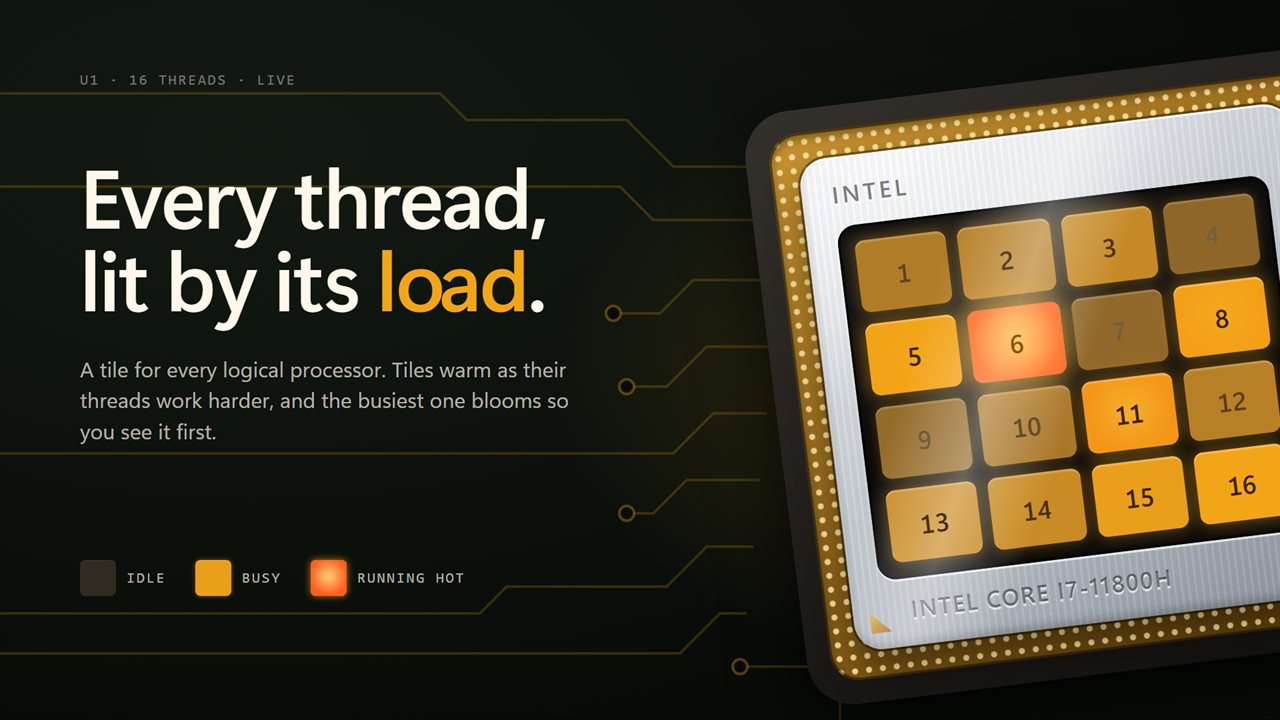
Every thread of your processor, glowing by how hard it works.
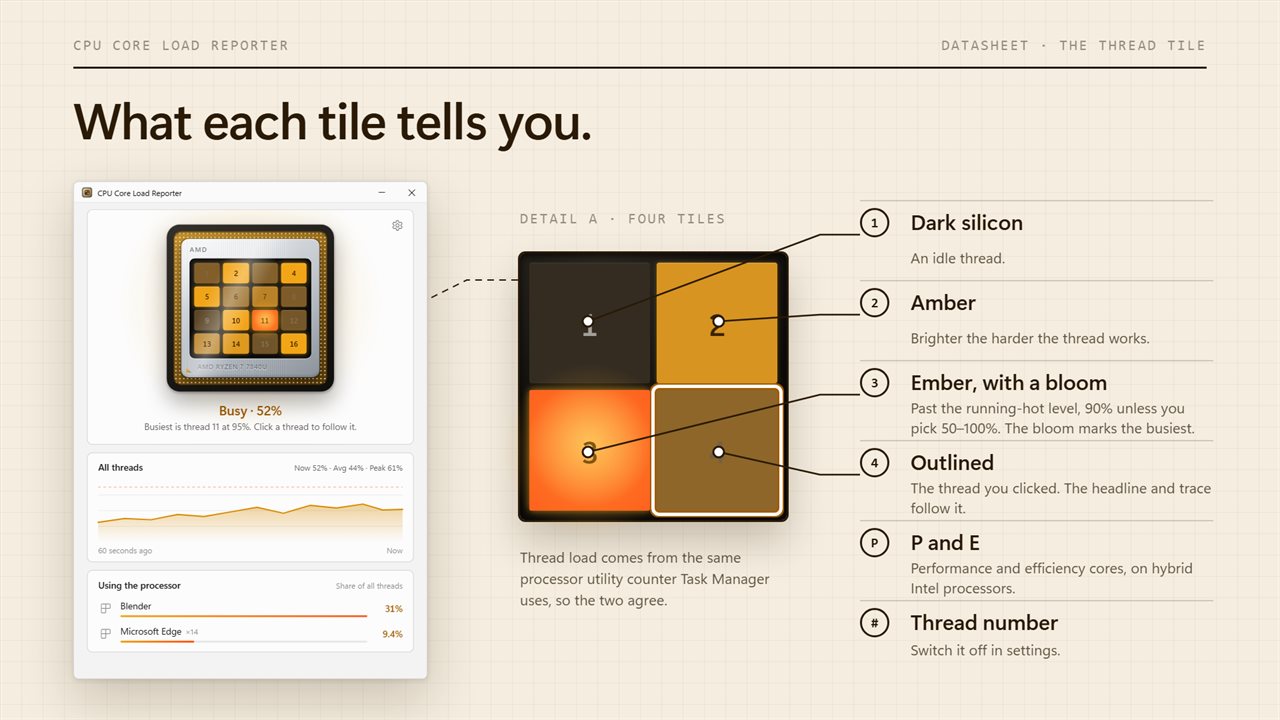
What each tile shows: load, running hot, busiest and followed.
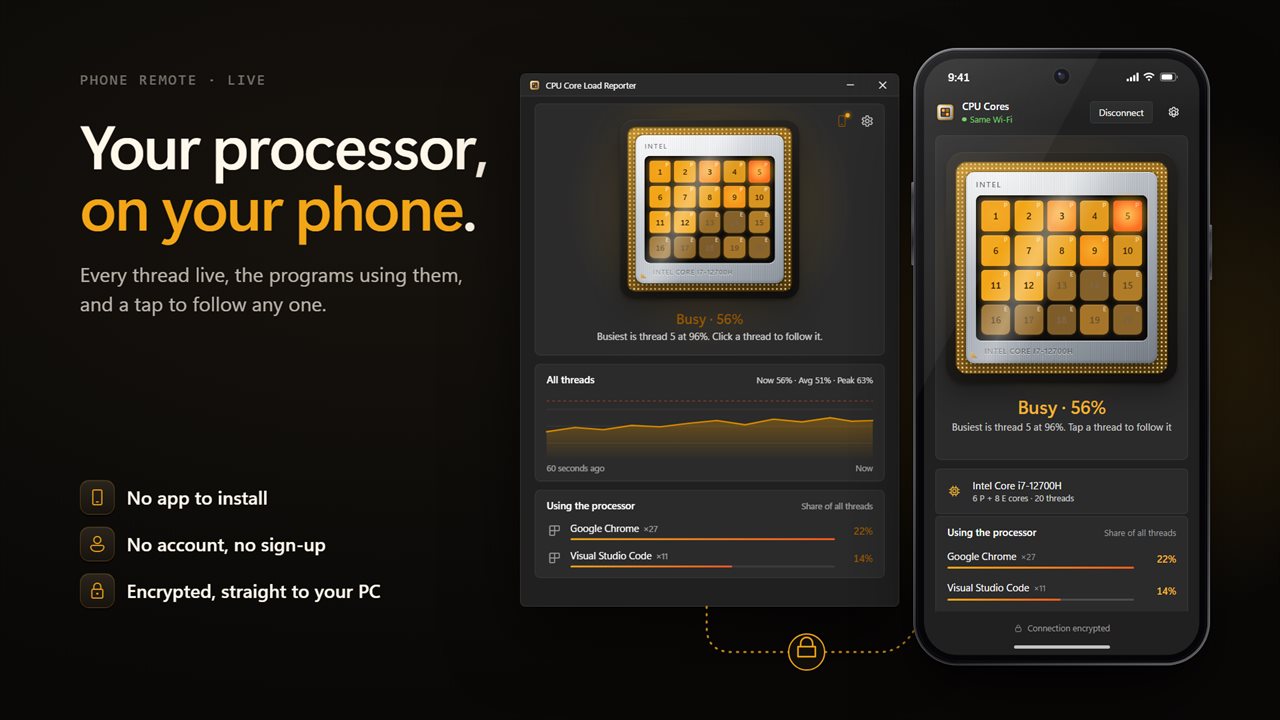
Watch every thread on your phone. No app to install, no account, and an encrypted link straight to your PC.
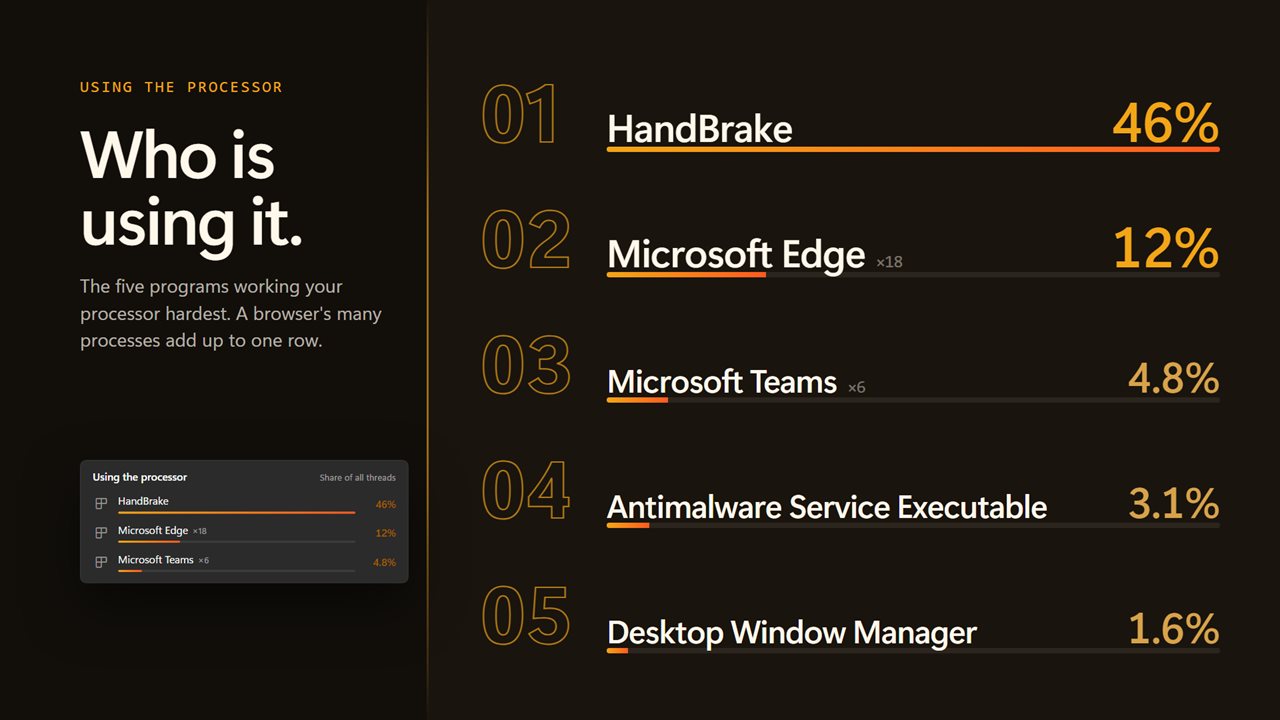
The five programs using the most processor right now.
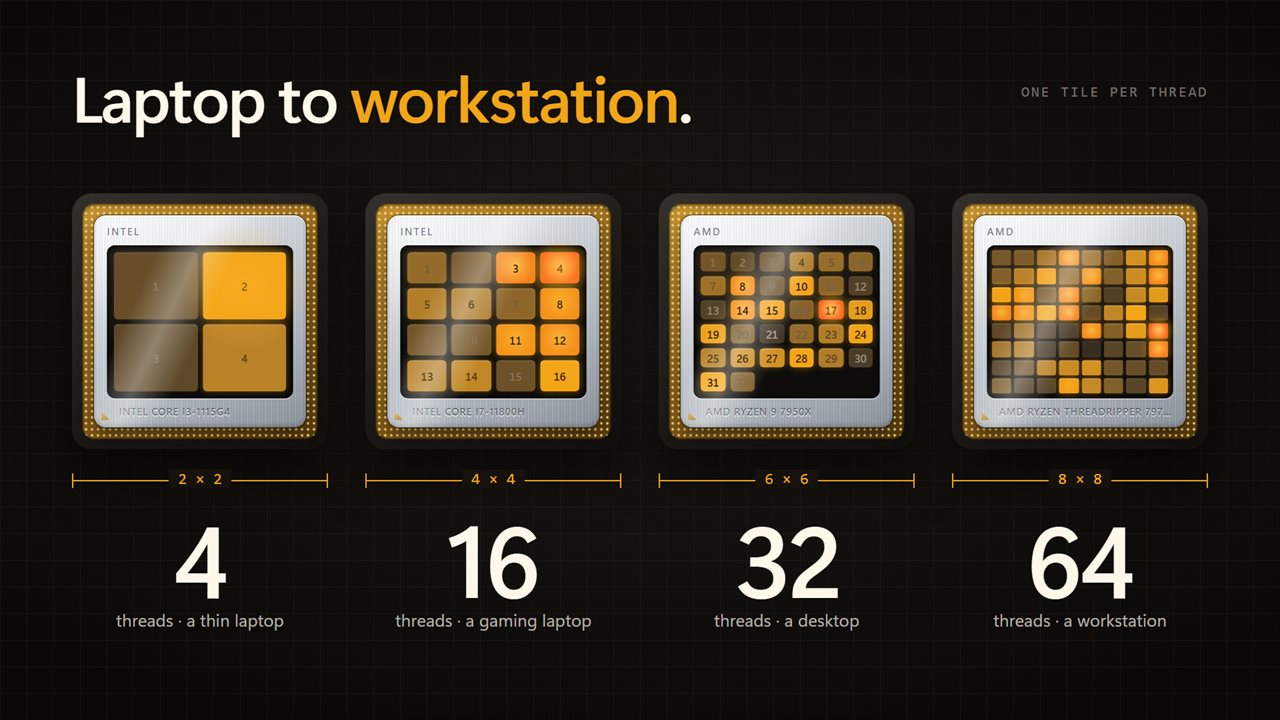
From a 4-thread laptop to a 64-thread workstation.
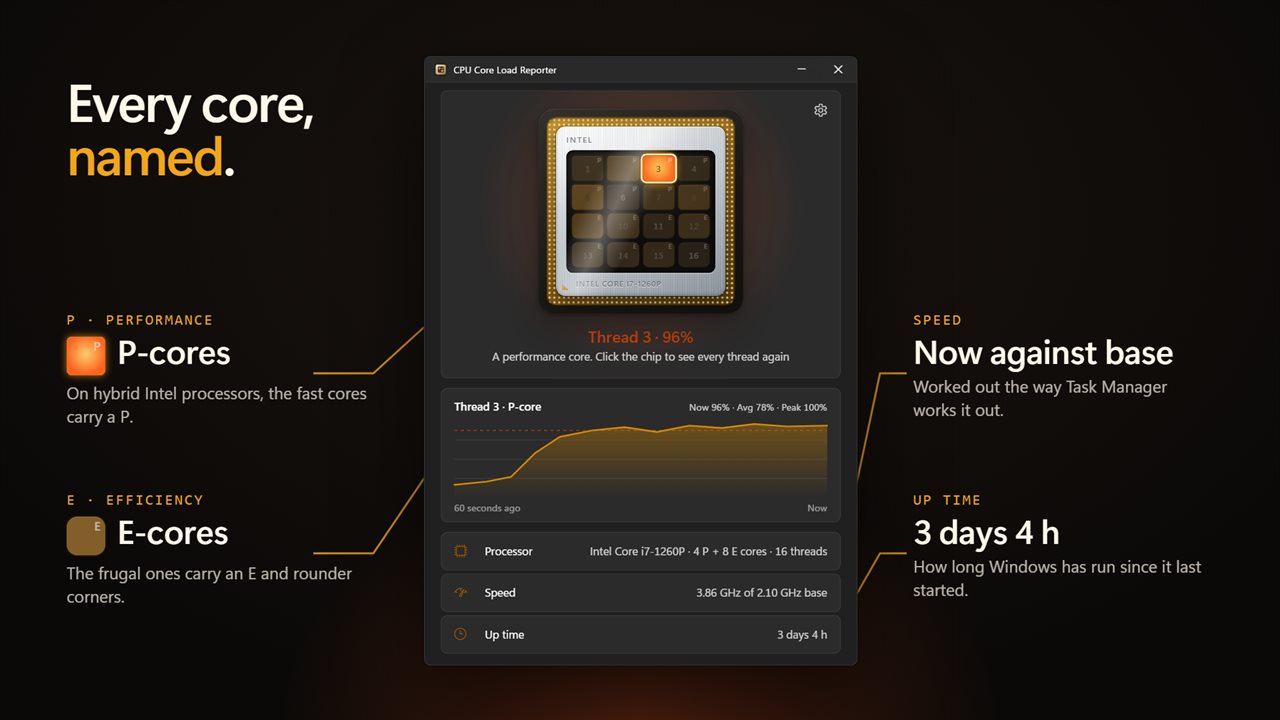
Performance and efficiency cores labeled P and E, plus up time.

Every thread of your processor, glowing by how hard it works.

190,000+downloads of EvlarSoft apps
Signed by EvlarSoftVerified US publisher
14-day money-backNo questions asked
Updates includedNo upgrade fees

A CPU monitor that shows usage on every thread

A total CPU usage figure hides most of the story. A game stuck on one thread can max out a single logical processor while the overall number reads a modest 15%, and a background update can spread lightly across all of them. CPU Core Load Reporter is a CPU monitor that puts every thread in view at once, so you can tell which kind of busy you are looking at.

The processor is drawn as a chip seated in its socket, with the model name printed on the lid and the silicon visible underneath. Each logical processor gets its own square on that silicon, warming from dark through amber to ember as it works harder, and the busiest square picks up a soft bloom. Above the chip a headline sums up the state in one word, Idle, Light, Busy or Running hot, next to the percentage, and the hint below it names the busiest thread.

Load is read from the Processor Utility counter, the same one Task Manager uses, so the two agree rather than leaving you to work out which is right.

How to check CPU usage per core without Task Manager graphs

Task Manager can show logical processors, but only after you right-click the CPU graph and change its view, and then you get a wall of small identical charts. Here the chip is the view. To dig into one thread:

  • Click its tile. The headline switches to that thread's load and the trace below draws its last 60 seconds, with Now, Avg and Peak.
  • Use the arrow keys to step from thread to thread.
  • Click the chip outside the tiles to go back to All threads.
  • Open Settings to choose Update every (Half a second, 1 second or 2 seconds) and to move the Running hot above slider between 50% and 100%.

Find what is causing high CPU usage

Under the trace, a panel called Using the processor lists the five programs with the biggest share right now, each with its icon and its share of all threads. A program that splits itself into many processes, as browsers do, is counted as one row with the number of processes beside it, so the real culprit is not hidden behind a dozen small entries. The list refreshes every two seconds and only observes; it never closes anything.

Below that sit the processor's details: model, core and thread counts, live speed against base speed, uptime since Windows last started and, where the firmware reports it, the voltage.

P-cores and E-cores, labeled on the chip

On a hybrid processor, not every thread is equal. The app counts performance and efficiency cores separately, shows the split as P and E core totals, and badges each tile with P or E. That makes it easy to see whether a heavy task is running on the fast cores or has landed on the efficiency ones.

Watch your CPU from your phone

Click Watch on your phone and scan the code. The same chip opens in the phone's browser, with every thread live, the headline and the busiest programs, and you can tap a thread to follow it there too. Nothing needs to be installed on the phone. It is handy for keeping an eye on a long render or a game from across the room without alt-tabbing.

Features

  • Every logical processor drawn as a tile that glows with its load
  • Click or arrow-key through threads to follow one on a 60-second trace
  • Now, average and peak for the total or the chosen thread
  • Top five programs by processor share, multi-process apps merged into one row
  • Model, cores, threads, live speed against base, uptime and voltage where reported
  • P and E badges on hybrid processors
  • Updates every half second, 1 second or 2 seconds, with an adjustable running-hot level
  • Live view on a phone browser by scanning a code

What's new in 2.1.4

  • New: your processor drawn in its socket, with a glowing tile for every thread
  • New: click a thread to follow it on a 60-second trace
  • New: total load trace with now, average and peak
  • New: the five programs using the most processor, with icons
  • New: P and E labels for performance and efficiency cores on hybrid processors
  • New: how long Windows has been running
  • New: current speed against base speed, and cores and threads
  • New: settings for update speed, the running-hot level and thread numbers
  • New: light and dark themes that follow Windows
  • Load figures now match Task Manager

Questions

Anything else? Ask us

Why do CPU Core Load Reporter's numbers match Task Manager and not other monitors?

It reads the same Windows counter Task Manager uses, Processor Utility, for the total and for every thread, and caps it at 100% the way Task Manager does. Tools that read the older Processor Time counter can show lower figures when the processor is boosting.

Does it show CPU temperature?

No. It shows the load on each thread, the current speed against the base speed, uptime, and the voltage on PCs whose firmware reports one. Temperature is not read at all.

Does it show performance and efficiency cores separately?

Yes. On a processor whose cores come in more than one efficiency class, it counts the performance and efficiency cores separately and labels each tile P or E on the chip.

How often does it update?

Every half second, every second or every 2 seconds, as you choose. The list of the five busiest programs refreshes every 2 seconds.

Can I end a program from the busiest-programs list?

No. The list shows the five programs using the most processor, with their icons and share of all threads, and adds up a program that runs as many processes into one row. It does not close or change them.

How does the phone view connect to my PC?

Scan the code in the app and the chip opens in your phone's browser, with no app to install. It connects directly over your local network where it can, and can also connect over the internet, with EvlarSoft's handshake server only setting up the link. Messages between the two are encrypted.

What is the difference between cores and logical processors?

A core is a physical processing unit. Many cores run two threads at once, and Windows treats each thread as a logical processor. The app shows both counts and draws one tile per logical processor.

Why is one thread at 100% when total CPU usage is low?

Software that cannot split its work runs on a single thread, which can max out one logical processor while the rest sit idle. The tile for that thread glows ember and the hint names it as the busiest.

Can I hide the thread numbers?

Yes. Turn off Number the threads in Settings. They are also hidden automatically when there are too many tiles to read.

Which versions of Windows does it run on?

Windows 10 (version 1809 or later) and Windows 11.

Is it a subscription?

No. CPU Core Load Reporter is a one-time purchase of $2.49, and updates are included.

How do I get it?

Buy it on this page and your license key arrives by email. If the button says Notify me, CPU Core Load Reporter is not on sale here yet; leave your email and we will tell you when it is.

Prefer widgets? The CPU Monitor widget on WidgetSpark does a similar job, alongside over 100 other desktop widgets in one app.