EEvlarSoft

Accurate Battery Stats

Check your laptop's battery health from every capacity reading Windows has saved, charted over time, with a replacement date only when the data can back one up.

Buy for $1.99
One payment. No subscription.
14-day money-back guarantee.
3.6
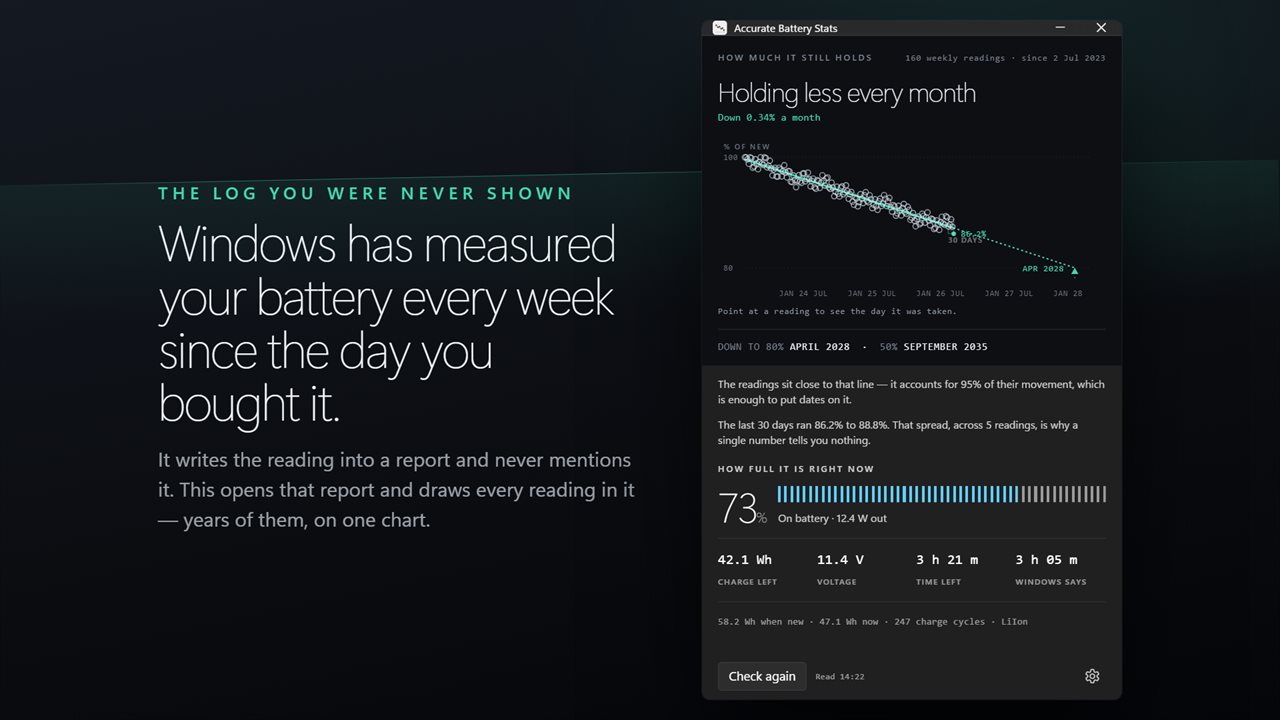
Windows has measured your battery every week for months, and never shows you. This opens that log.
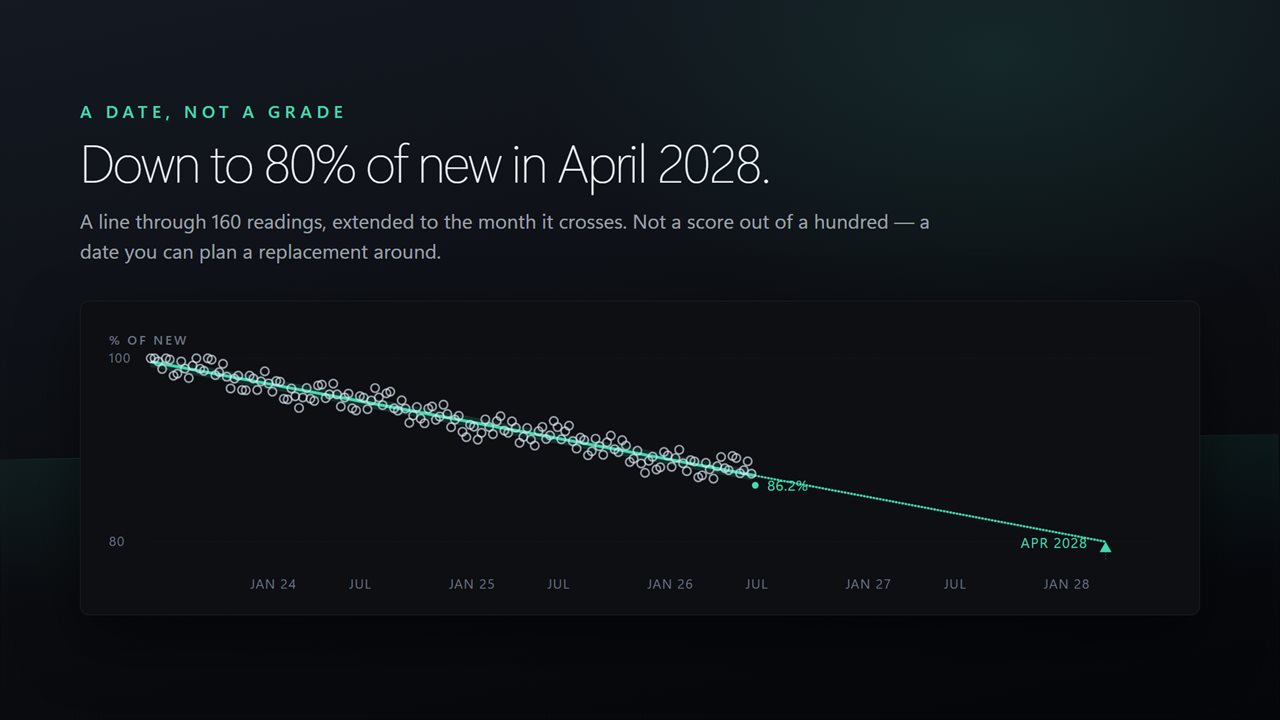
A line through every reading, extended to the month the pack drops to 80% of new. A date you can plan around.
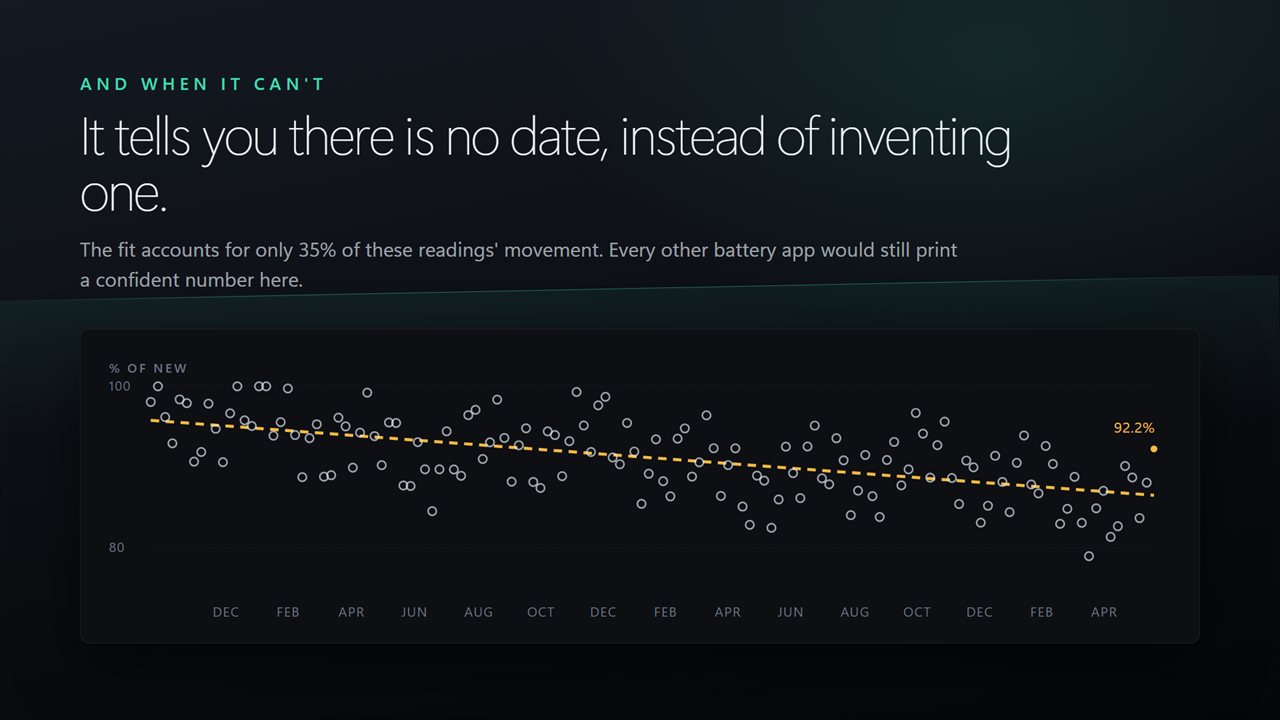
When the readings scatter too far to date anything, it tells you there is no date instead of inventing one.
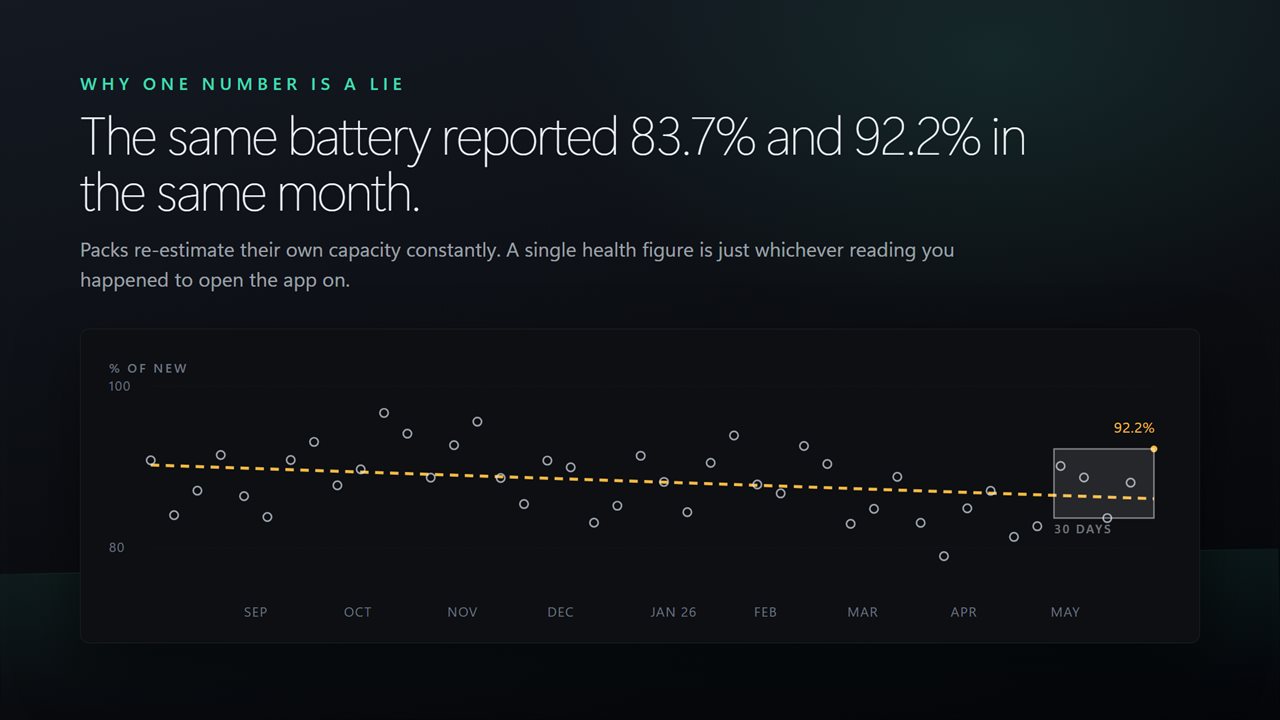
The same battery reported 83.7% and 92.2% in one month. That spread is why a single health figure means nothing.
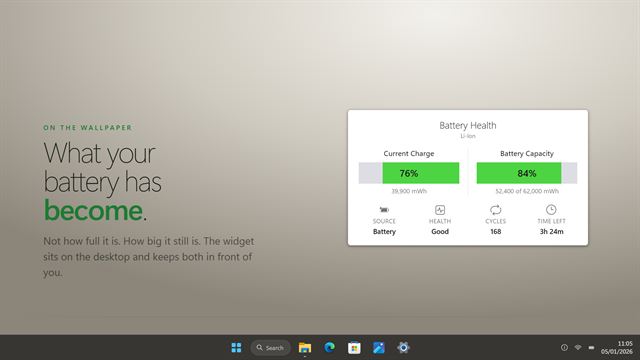
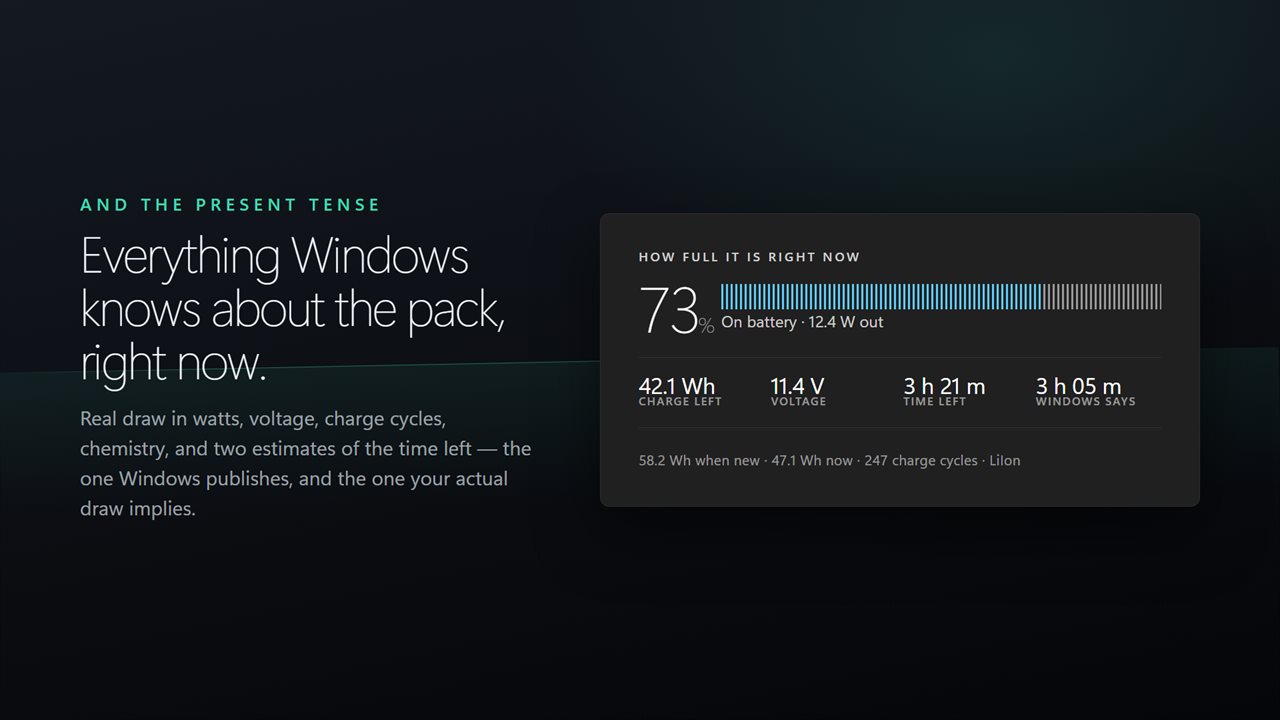
Charge, real draw in watts, voltage, cycle count and chemistry — plus your time left next to Windows' own estimate.

Windows has measured your battery every week for months, and never shows you. This opens that log.

190,000+downloads of EvlarSoft apps
Signed by EvlarSoftVerified US publisher
14-day money-backNo questions asked
Updates includedNo upgrade fees

How to check laptop battery health without trusting one number

The usual way to check laptop battery health on Windows is to run powercfg /batteryreport in a terminal, open the HTML file it writes, and divide full charge capacity by design capacity. You get a percentage, and the next time you try it you get a different one. That is not your battery failing faster; it is the nature of the readings. A battery's own estimate of what it can hold drifts up and down by several points from week to week.

Accurate Battery Stats runs that report for you and keeps the part most people skip: the Battery capacity history table, a dated reading roughly every week going back months, including the time before you installed anything. It draws all of them on one chart of design capacity against capacity today, shades the spread of the last 30 days, and lets you point at any dot to see the date it was recorded.

Looking at the whole cloud of points instead of a single sample is what tells you whether a battery is wearing out or simply reporting noisily.

When to replace a laptop battery

A line is fitted through the readings and labeled with how much of their movement it accounts for. The chart heading sums up what it sees, from Holding less every month to Losing capacity, unevenly or Holding more than it used to, which is common because packs recalibrate upward with use.

A replacement date is only drawn when it is justified: at least eight readings, a falling trend, and a line that explains at least half of the variation. Then the chart marks the month the pack is expected to reach 80% and 50% of its original capacity. Otherwise it tells you plainly that no date can be given, rather than extrapolating a guess from a noisy figure.

Battery report cmd, without the command line

Everything in the app comes from sources already on your PC: the powercfg battery report for history, and the battery itself for live readings. Select Check again after a few days to fetch the newest entries; Windows takes a few seconds to write the report, and the window keeps working while it does.

Some company-managed laptops block powercfg. In that case the error appears where the chart would be, and the live figures still work.

Battery cycle count, capacity and live draw

Beside the chart are the pack's vital statistics: capacity when new, capacity today, cycle count and chemistry. On laptops with two batteries the capacities are added together and the higher cycle count is shown. Under Show capacity in, choose watt-hours to match the label printed on the battery, or milliwatt-hours as Windows records it.

The live panel shows Charge left, Voltage, and whether the battery is charging, plugged in but not charging, or discharging, with the actual draw in watts. Time left is calculated from that draw and set next to the Windows says figure, which is a slow moving average that can still promise hours a minute after you open a game. Live figures refresh every 2, 5, 10 or 30 seconds.

What it reads and shows

  • Full capacity history from the Windows battery report, on one chart
  • Shaded band for the last 30 days of readings
  • Fitted trend labeled with how much variation it explains
  • Projected 80% and 50% capacity dates when at least eight falling readings support them
  • Design capacity, current full charge capacity, cycle count and chemistry
  • Combined figures for laptops with more than one battery
  • Live charge, voltage and draw in watts
  • Time left from live draw, shown beside the Windows estimate
  • Capacity in watt-hours or milliwatt-hours

What's new in 2.0.7

  • Rebuilt for Windows 11
  • New: every dated capacity reading Windows has kept, plotted on one chart
  • A fitted trend, labelled with how much of the movement it explains
  • Dates for 80% and 50% of new, only when the readings support them
  • The 30-day spread, so you can see how far a single reading moves
  • Real draw in watts, and time left at that draw next to Windows' own estimate
  • Light and dark, following Windows
  • Lower memory use and a faster start

Questions

Anything else? Ask us

Why does my battery health percentage change from week to week?

Because each figure is one reading, and the readings scatter. Instead of one number, the app plots every capacity reading Windows has logged and marks the range of the last 30 days, so you can see how far a single reading moves.

Will it tell me when to replace my battery?

Only when the readings support a date. It needs at least eight readings that are falling, with the trend line explaining at least half of their movement. Then it shows the month the pack reaches 80% and 50% of its original capacity; otherwise it says there is no date.

Does it need to run for months before it shows anything?

No. It reads the capacity history Windows already keeps in its battery report, so readings from before you installed the app are included. The chart needs two readings and a trend needs four.

Why is its time left different from the Windows estimate?

It works out time left from the draw in watts the battery reports right now, while Windows uses a slower moving average. Both are shown side by side, along with the current voltage and charge left.

What happens on a laptop with two batteries?

The capacity when new and the capacity today are added up across every pack. The cycle count shown is the highest of the packs, and the number of packs is listed.

Does it work on a work laptop that blocks battery reports?

Partly. The history comes from powercfg, which some managed PCs block, and in that case the app shows the error in place of the chart. Live charge, draw and time left still come straight from the battery.

What is a good battery health percentage for a laptop?

Above 80% of design capacity is generally healthy; many manufacturers treat 80% as the end of normal life. Because single readings vary, judge it from the trend across many readings, which is what the chart shows.

How do I check my battery cycle count on Windows?

Windows lists it in the battery report that powercfg /batteryreport generates, if the battery reports it. This app reads that value and displays it next to the capacity figures.

Why is full charge capacity higher than design capacity?

The battery's gauge recalibrates as it is cycled and can overestimate for a while, especially in a new pack. It is a measurement quirk, which is why the app treats a rising record as normal and does not project a date from it.

Which versions of Windows does it run on?

Windows 10 (version 1809 or later) and Windows 11.

Is it a subscription?

No. Accurate Battery Stats is a one-time purchase of $1.99, and updates are included.

How do I get it?

Buy it on this page and your license key arrives by email. If the button says Notify me, Accurate Battery Stats is not on sale here yet; leave your email and we will tell you when it is.