

EEvlarSoft

Memory Usage Monitor

Check RAM usage live in one small window, see which apps are taking the most memory, and find out what kind of RAM is in your PC.

Buy for $1.99
One payment. No subscription.
14-day money-back guarantee.
5.0
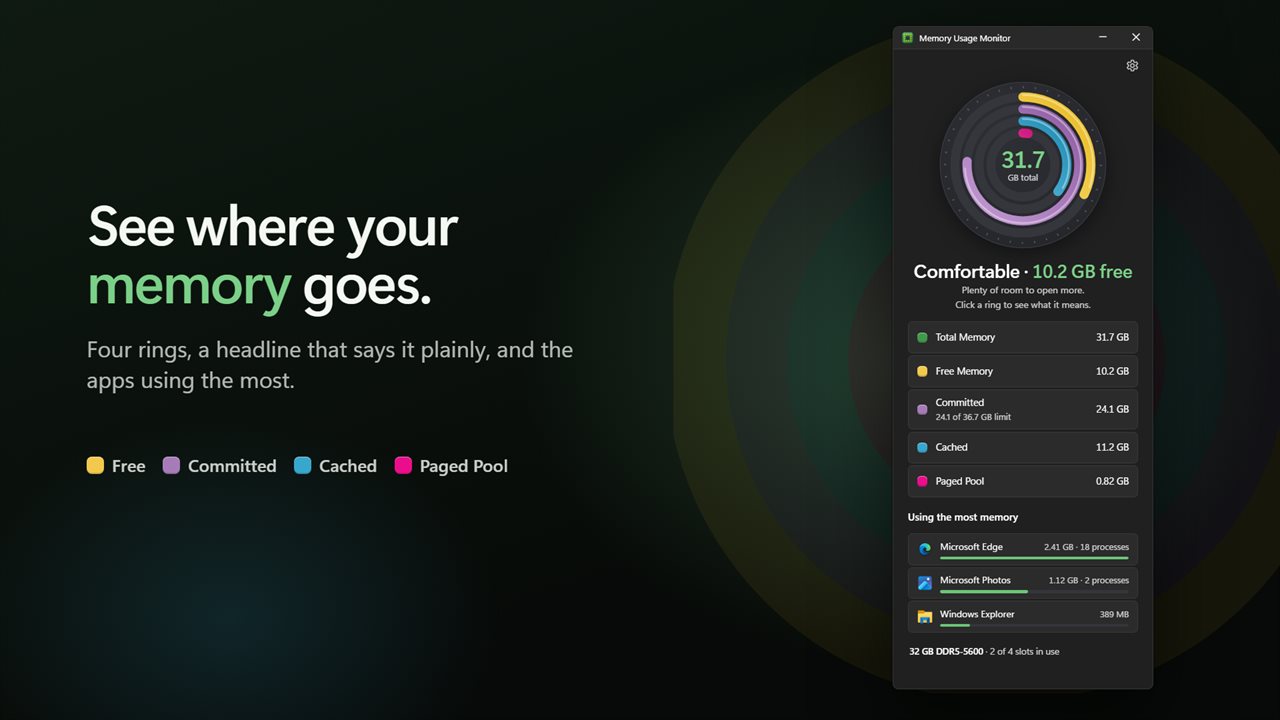
See where your memory goes, at a glance.
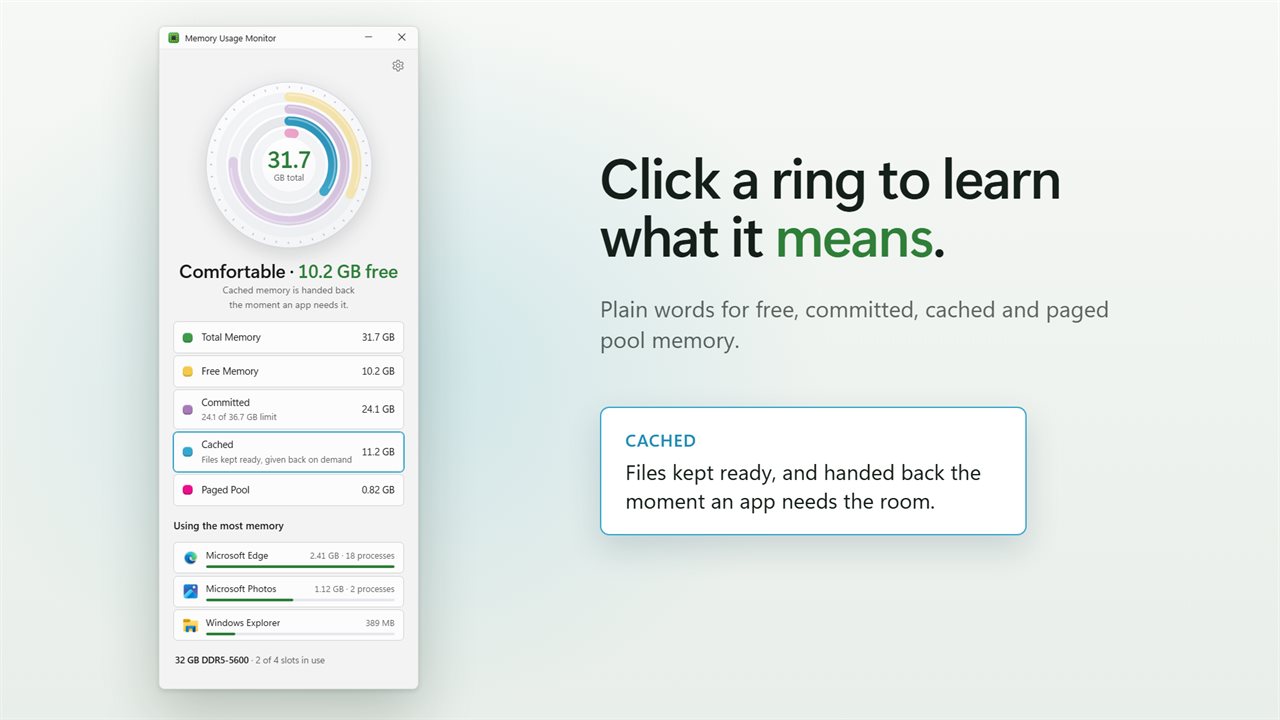
Click a ring to learn what it means.
The apps using the most memory, all their processes added up.
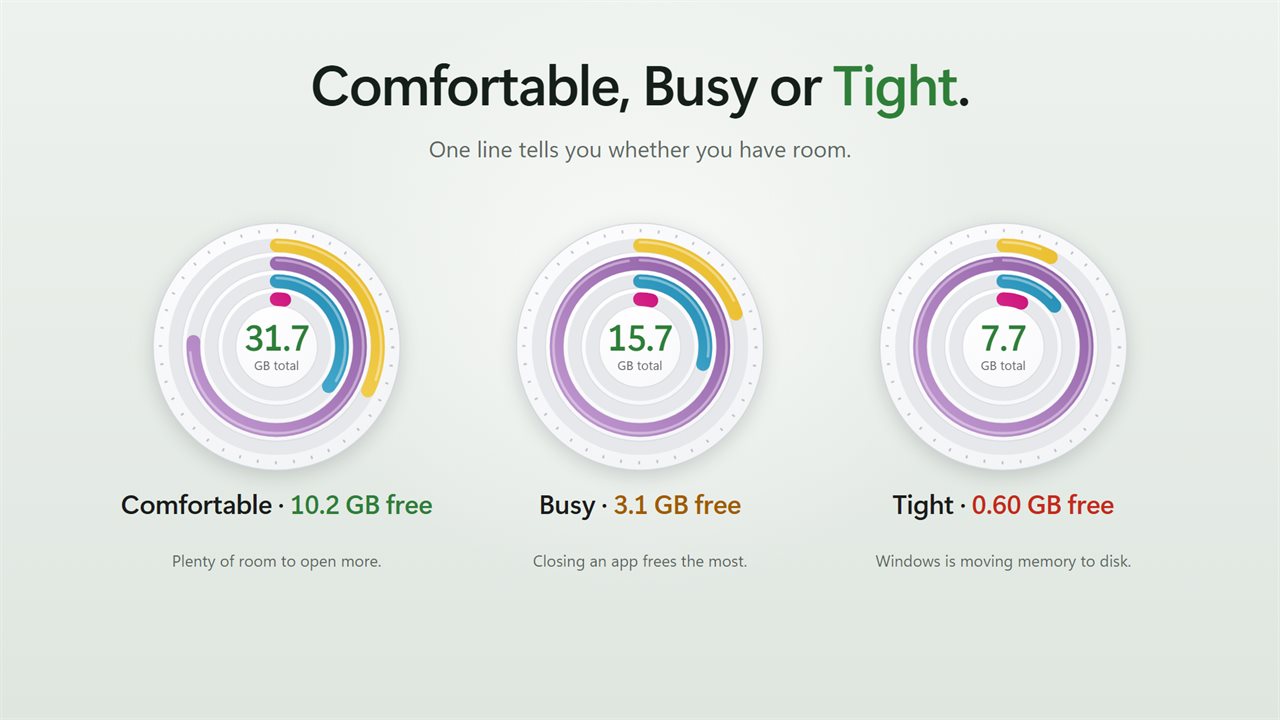
Comfortable, Busy or Tight. One line tells you.
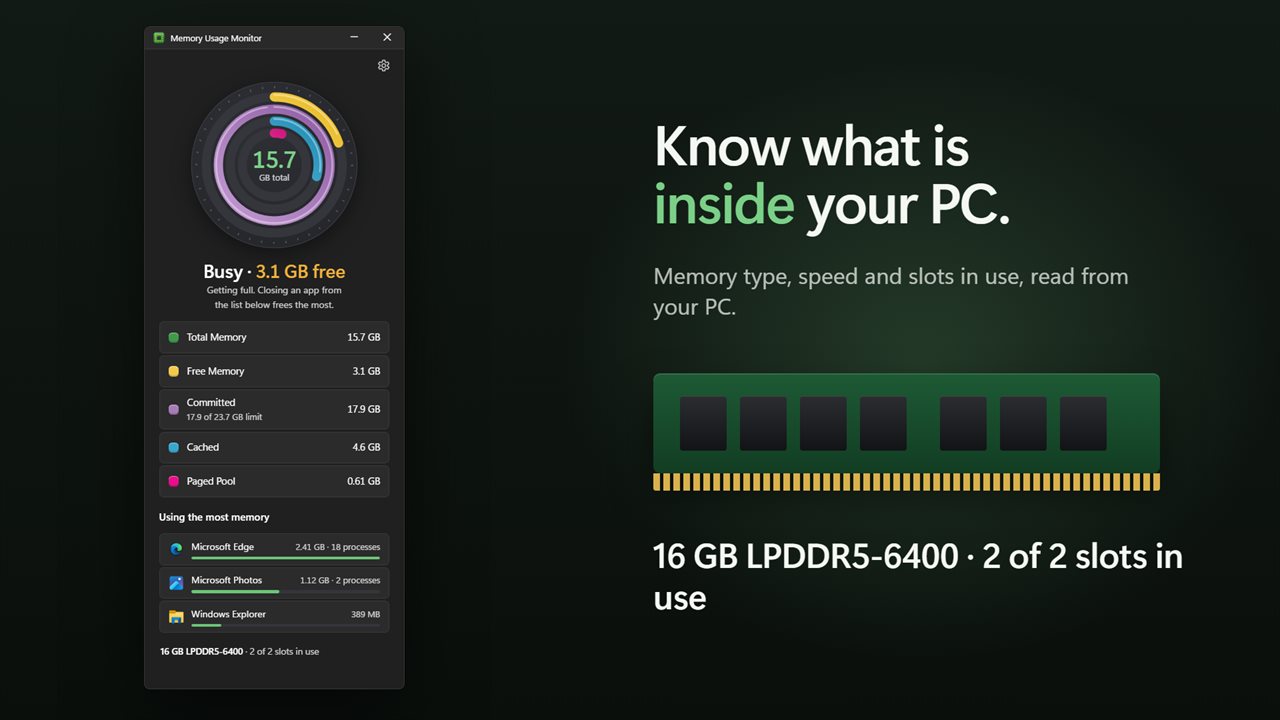
Your memory type, speed and slots in use.
Light or dark, and always on top if you like.

See where your memory goes, at a glance.

190,000+downloads of EvlarSoft apps
Signed by EvlarSoftVerified US publisher
14-day money-backNo questions asked
Updates includedNo upgrade fees

Check RAM usage without digging through Task Manager

The usual advice for checking RAM usage on Windows is to open Task Manager, find the Performance tab, then go back to Processes and sort a column. It works, but it gives you a lot of numbers and very little meaning. Memory Usage Monitor answers the two questions people actually have: is memory actually short, and if so, which program is to blame?

Four colored rings track free, committed, cached and paged-pool memory, each measured against the installed RAM, with your total memory printed in the center. Beneath them sits a one-word verdict, Comfortable, Busy or Tight, along with how many gigabytes are free right now.

Below that, a short list ranks the heaviest programs, each shown with its own icon and a length of bar so the gap between them is obvious. Hover over one to see the folder it runs from.

Why is my RAM usage so high?

A high percentage on its own is not a fault. Windows deliberately fills spare memory with cached files, because unused RAM does nothing for you, and it hands that cache back the moment a program asks. What matters is whether free memory stays low while you work and how close committed memory is getting to the commit limit.

That is why the rings are split the way they are. Click a ring to read a one-sentence description of that kind of memory, so you can tell harmless caching from real pressure. The Committed row also shows that figure against the commit limit.

When something really is hogging memory, the list of top apps shows it. Programs split across many processes, such as web browsers, are combined into one line with a count, so a browser with forty tabs shows its true combined total instead of hiding across dozens of entries.

Cached, committed and paged pool memory, explained

These four terms are where most of the confusion about Windows memory comes from. Each ring in the app stands for one of them:

  • Free: memory holding nothing at all, ready for the next app you open.
  • Committed: memory programs and Windows have asked to have set aside, whether it currently sits in RAM or in the page file. It can grow up to the commit limit, which is RAM plus the page file.
  • Cached: recently used files kept ready in RAM, handed back the moment an app needs the space.
  • Paged pool: memory Windows keeps for drivers and the system itself, which can be moved out to disk when idle.

What RAM do I have? Type, speed and slots

Before you buy more memory, you need to know what is already installed. The app reads the memory type, such as DDR4 or DDR5, its speed, and how many of the board's slots are filled, as reported by the PC's firmware. When the firmware does not report a value, it is left blank rather than guessed.

Under Settings you can set Update every to 1 second, 2 seconds or 5 seconds, choose 3 or 5 for Apps shown, and switch on Always on top to keep the readings in view while you test a heavy app. Readings pause while the window is minimized.

What Memory Usage Monitor shows

  • Live rings for free, committed, cached and paged-pool memory
  • Total installed memory in the center of the rings
  • A plain verdict of Comfortable, Busy or Tight with free gigabytes
  • Click any ring for a one-line explanation of that kind of memory
  • Committed memory against the commit limit
  • Top 3 or top 5 apps by memory, multi-process apps combined
  • App icons, size bars and install location on hover
  • RAM type, speed and slots in use
  • Refresh every 1, 2 or 5 seconds; Always on top; Light, Dark or Match Windows

When a RAM monitor helps

A PC that has started to crawl

See in seconds whether memory is the bottleneck and which app is responsible.

Planning an upgrade

Check your memory type, speed and free slots before ordering new modules.

Gaming and creative work

Keep it on top while a game or an editor loads a big project and watch the rings move.

What's new in 2.0.3

  • New: four rings for free, committed, cached and paged pool memory, each now drawn correctly
  • New: a headline that says whether you have room, and plain explanations when you click a ring
  • New: the apps using the most memory are added up across all their processes
  • New: your memory type, speed and slots in use
  • New: choose how often it updates, show 3 or 5 apps, and keep it on top
  • Closing the window now closes the app

Questions

Anything else? Ask us

Does it free up RAM or clean memory?

No. It only shows how your memory is being used and which apps use the most. It does not close apps or trim their memory.

Why are the app sizes different from Task Manager?

It ranks apps by private bytes, the memory each one has reserved for itself, whether that sits in RAM or the page file. Task Manager's Memory column counts a different figure, so the numbers will not match exactly.

Why does my browser show as one line instead of many?

Processes with the same program name are added together into one line, with their real icon and a count of how many are running. The list shows the top 3 or top 5 apps.

Can it tell me what type of RAM I have and how many slots are free?

Yes, when the PC's firmware reports it. It shows the memory type, such as DDR4 or DDR5, its speed, and how many slots are in use out of the total. Anything the firmware does not report is left out.

What do Comfortable, Busy and Tight mean?

They are based on how much of your installed RAM is in use: under 70% is Comfortable, 70% to 85% is Busy, and 85% or more is Tight.

Does it keep using CPU in the background?

It reads memory every 1, 2 or 5 seconds, as you choose, and stops reading while the window is minimized.

How do I see which app is using the most RAM?

Look at the list headed Using the most memory. The largest program comes first, with its size and a bar beside it, and hovering over it shows the folder it runs from.

Is high cached memory a problem?

No. Cached memory holds files Windows expects to need again and is released immediately when an app asks for memory. Click the Cached ring in the app for a one-line explanation.

What is the commit limit?

It is the most memory Windows can promise to programs at once: your installed RAM plus the page file. The Committed row shows how much of it is in use. When committed memory nears the limit, apps can fail to open or slow down.

Which versions of Windows does it run on?

Windows 10 (version 1809 or later) and Windows 11.

Is it a subscription?

No. Memory Usage Monitor is a one-time purchase of $1.99, and updates are included.

How do I get it?

Buy it on this page and your license key arrives by email. If the button says Notify me, Memory Usage Monitor is not on sale here yet; leave your email and we will tell you when it is.

Prefer widgets? The RAM Monitor widget on WidgetSpark does a similar job, alongside over 100 other desktop widgets in one app.