A stock ticker for desktop work, not another browser tab
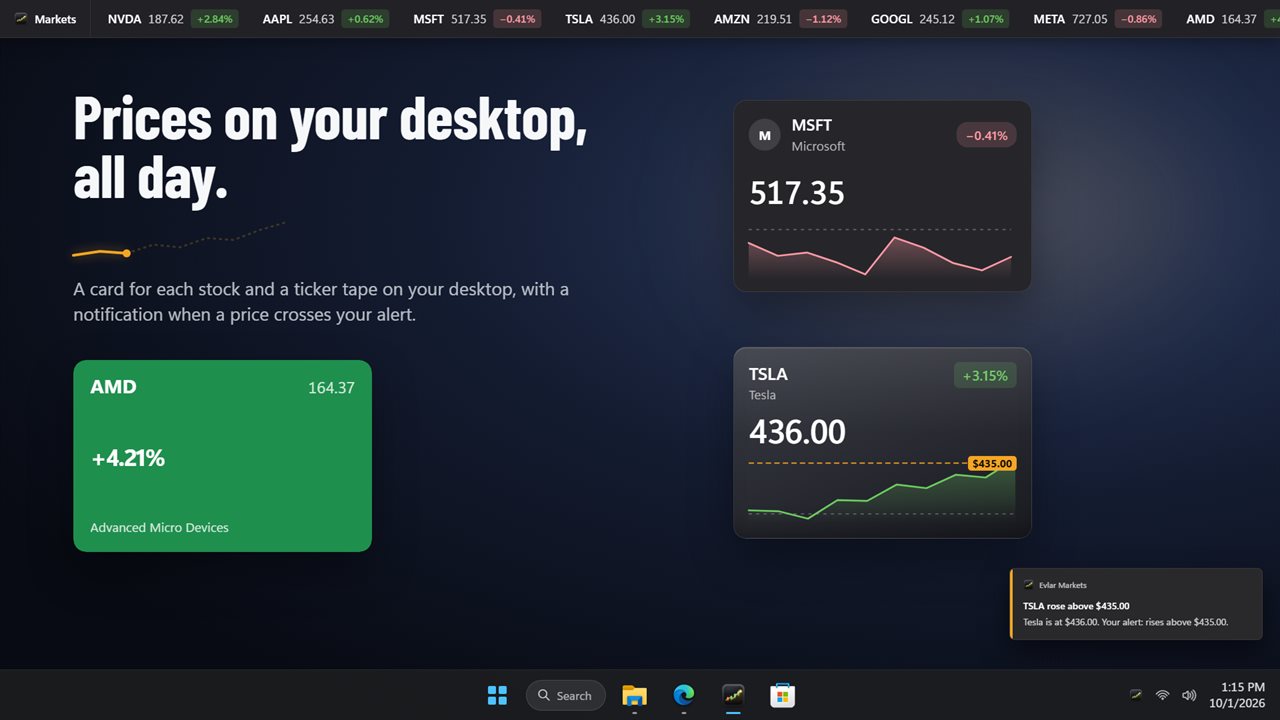
Checking prices usually means switching to a browser, finding the tab and refreshing it. Evlar Markets puts a stock ticker for desktop use directly on the screen instead. A tape docks along the top or bottom edge of the screen and stays there while you work in other windows. On a multi-monitor setup you can show it on one display or across all of them.
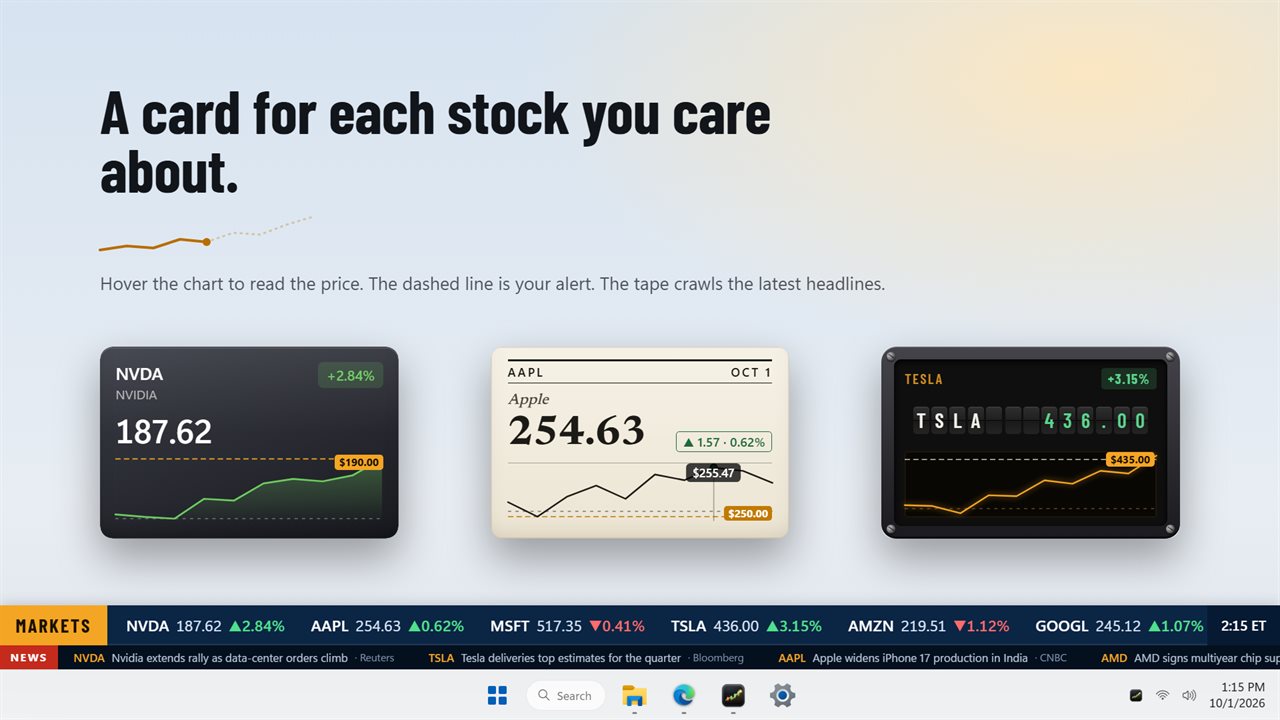
Next to the tape, any symbol can become its own stock card that you drag wherever it fits, and it reopens in the same spot the next time. Each card draws its own intraday chart. Move the pointer across the chart and it shows the price at that point of the day, and if you have an alert on that stock, its level appears as a dashed line.
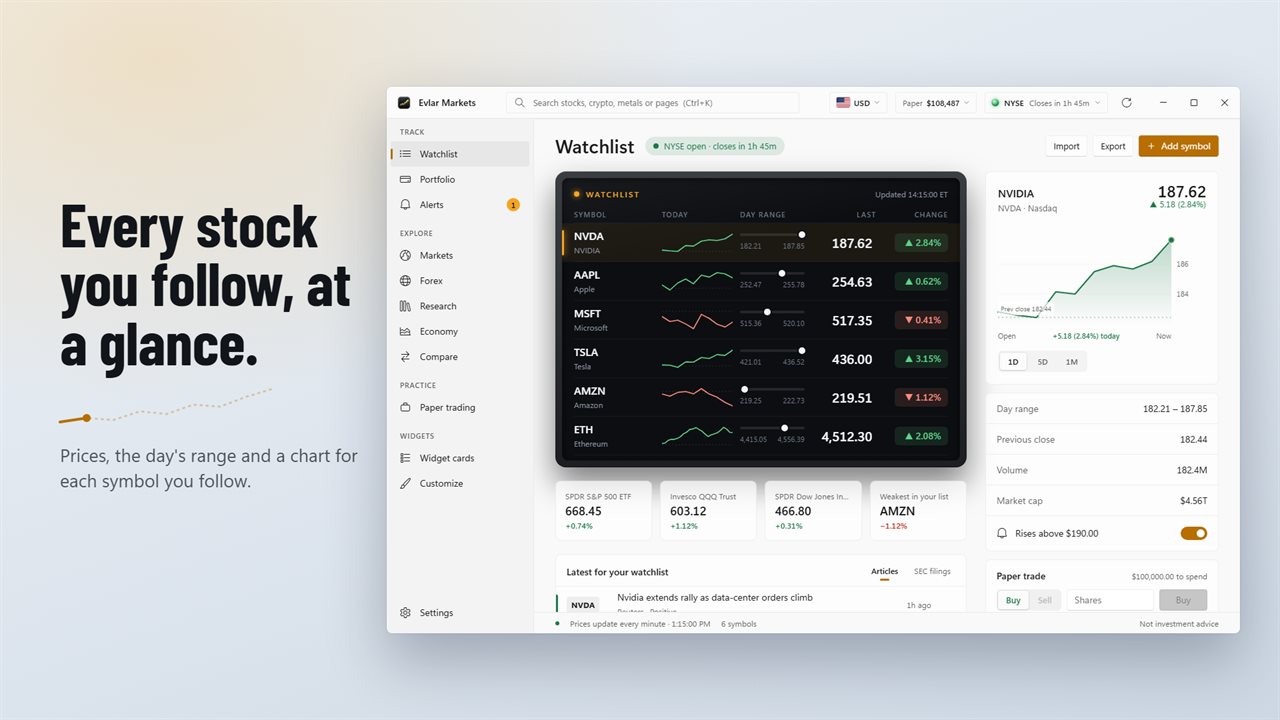
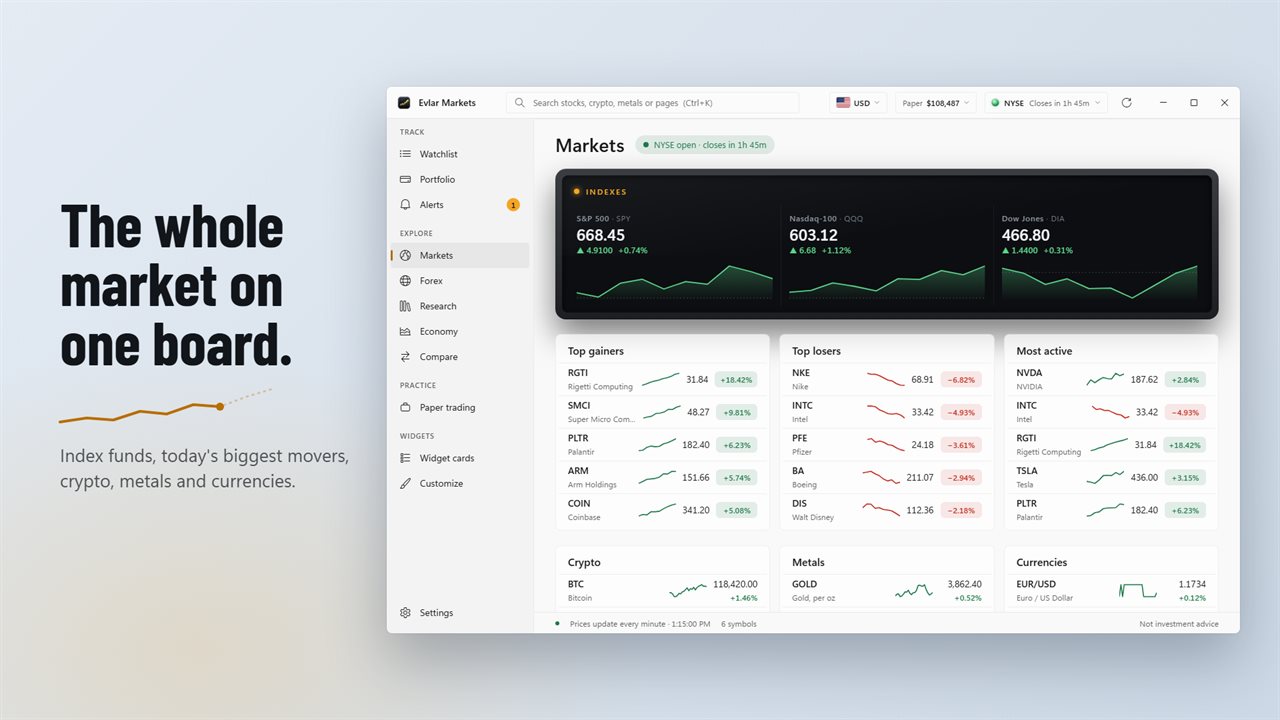
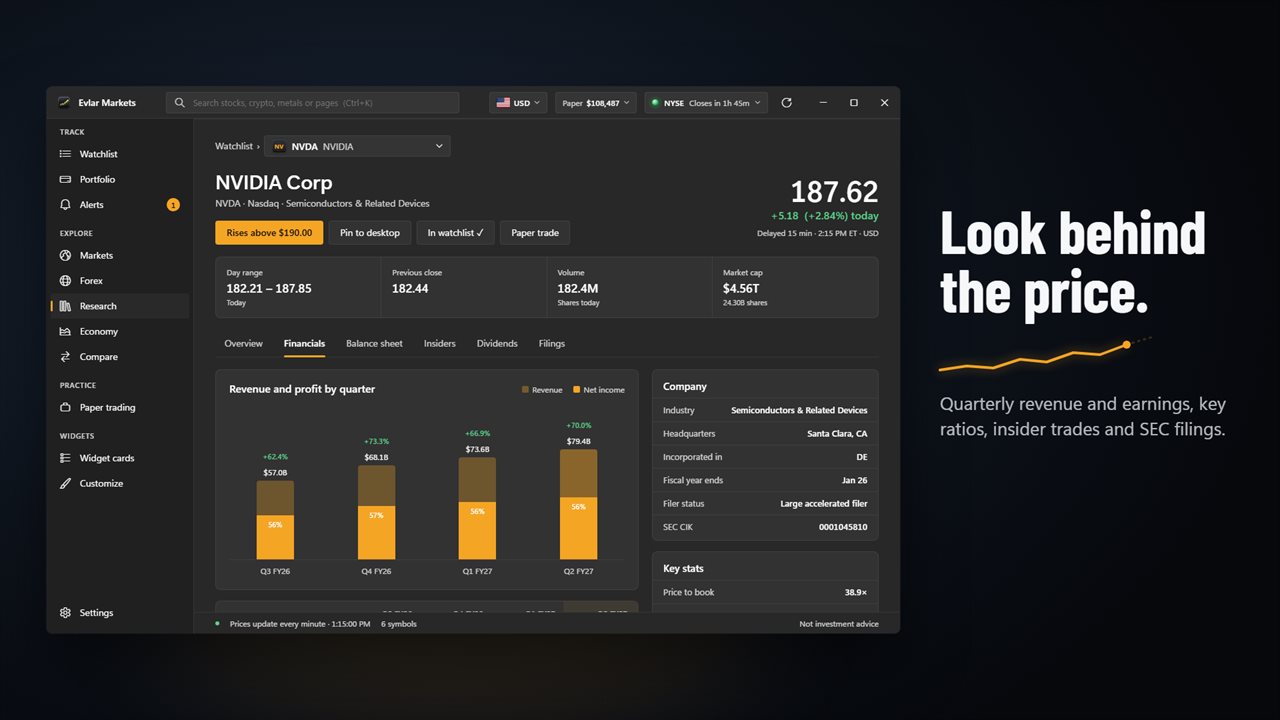
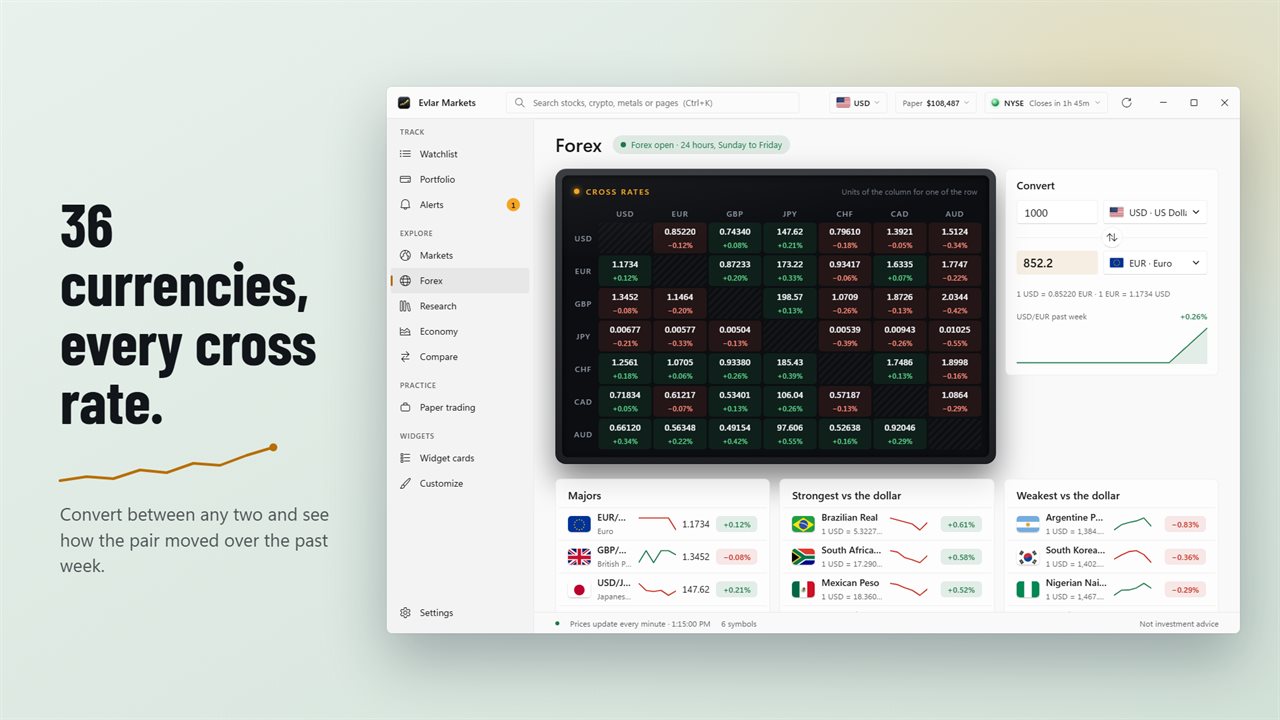
Behind the widgets is a full app: a watchlist board, a detailed chart per symbol, a Markets overview and a practice account. The widgets are the part you look at all day; the app is where you go when something moves.
Stock ticker tape styles and desktop stock widgets
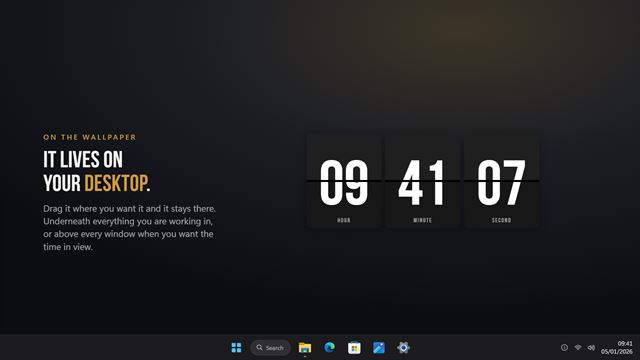
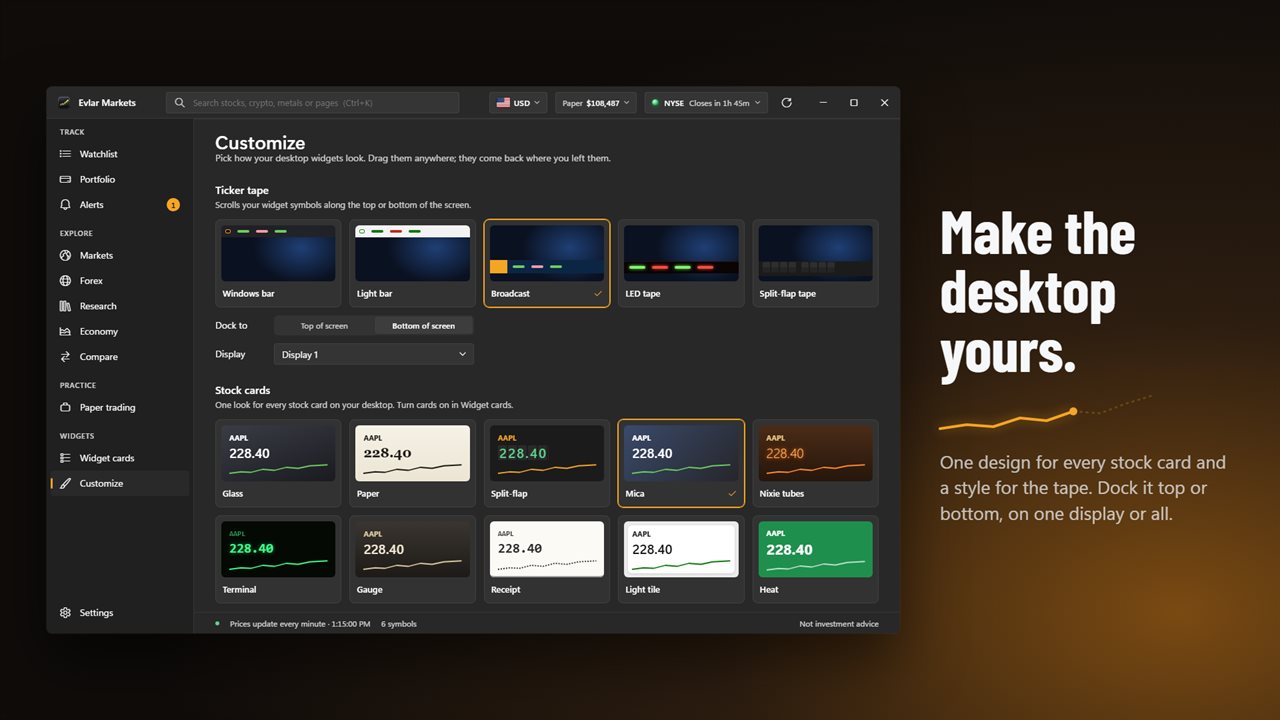
The tape comes in five looks. Windows bar and Light bar are plain and quiet. LED tape and Split-flap tape imitate the boards on a trading floor and in a train station. Broadcast reads like a news channel crawl and also scrolls recent headlines for the symbols on it.
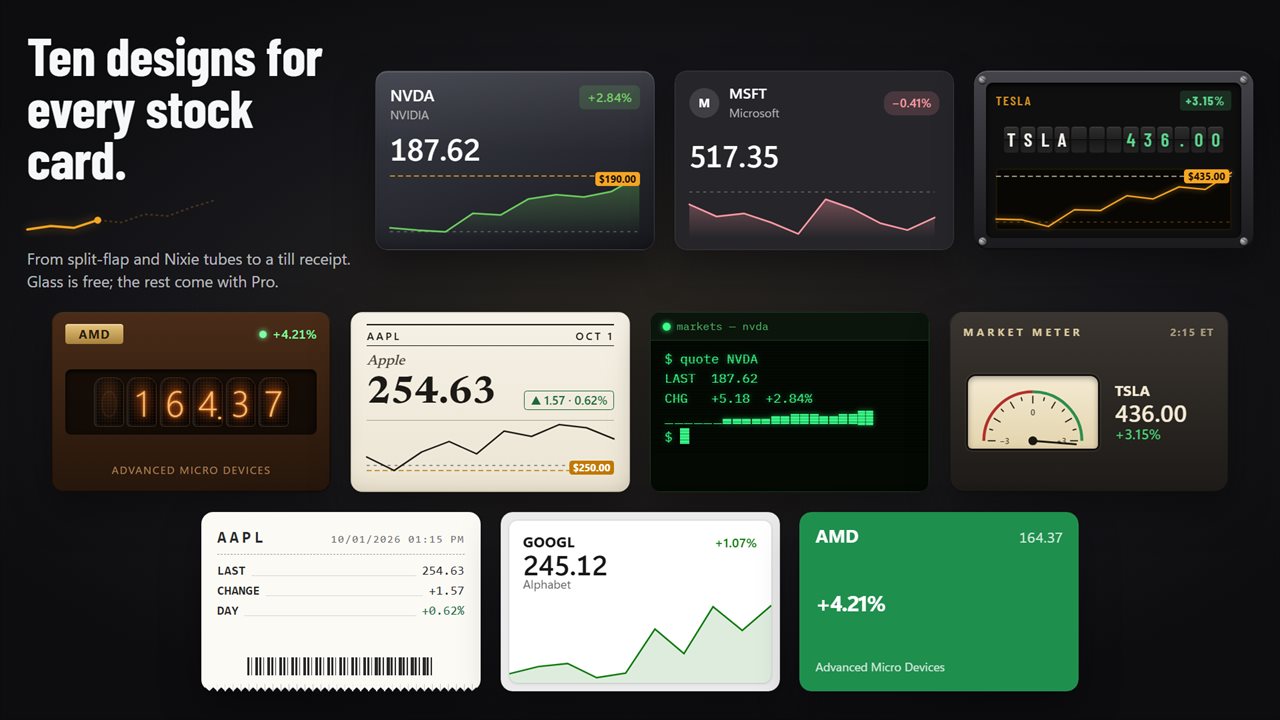
Cards have ten designs. Some are calm, like Glass, Mica, Paper and Light tile; some are playful, like Nixie tubes, a till Receipt and Gauge; Terminal and Split-flap sit in between. Heat turns the whole watchlist into one heat map, each tile colored by today's move. You pick one design under Customize and every card changes together, or right-click a single card to change it or remove it. A transparency setting fades the widget backgrounds while numbers and lines stay fully opaque.
Stock price alerts on Windows
Set a level above or below the current price and Evlar Markets watches it. When the price crosses, you get a normal Windows notification. Closing the main window only hides it to the notification area, so alerts keep checking until you quit from the tray icon. Hovering that tray icon also shows your watchlist prices without opening anything.
Watchlist, stock portfolio tracker and paper trading
On the watchlist board every row carries a sparkline of today's trading, the high-to-low range, the latest quote and how far it has moved. Drag rows into your own order. Pick a row to open a larger chart you can switch between one day, five days and one month, with the previous close, volume and market cap beside it.
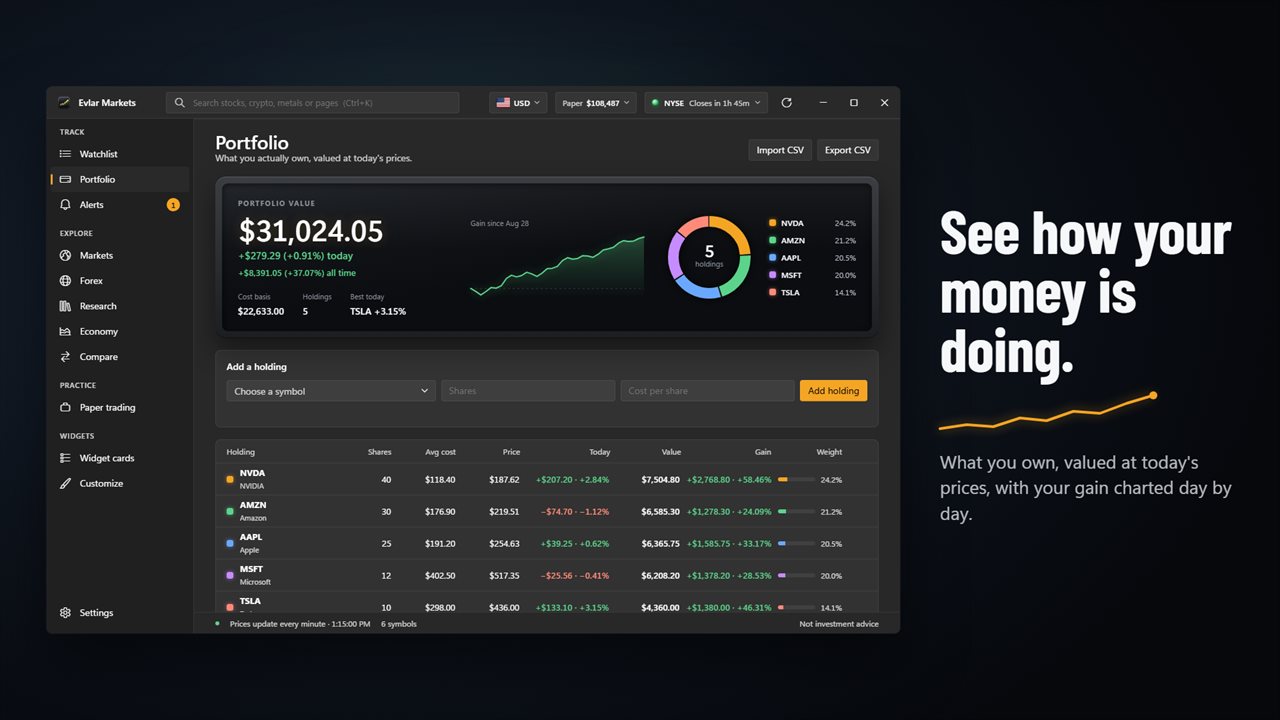
Portfolio holds what you actually own. Add a holding with its shares and cost per share and it is valued at today's prices with gain, gain today, weight and cost basis. Import CSV reads a broker export, recognizing common headers such as Symbol or Ticker, Shares or Quantity, and Avg Cost; Export CSV saves it back out.
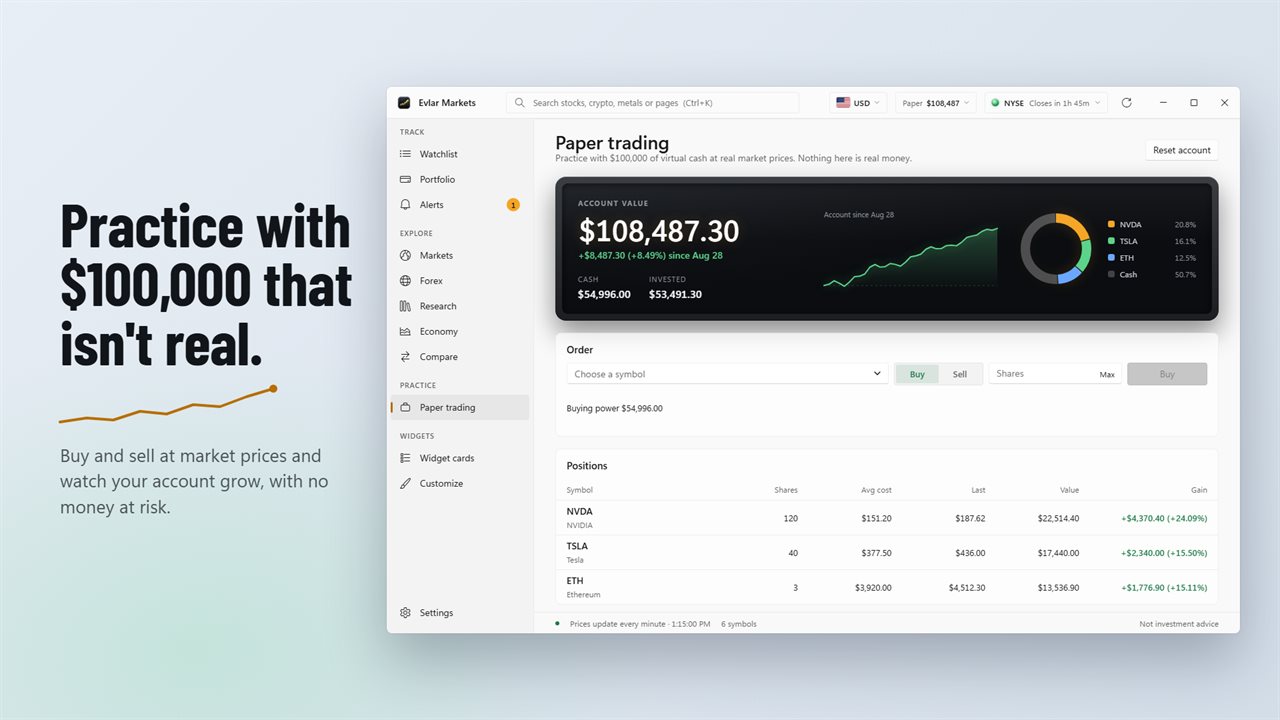
For practice, the paper trading account starts with $100,000 of virtual cash and fills each order at a price fetched when you place it. Reset it whenever you want a clean start.