EEvlarSoft
The CPU meter gadget, back

System Health Widget

A system monitor widget that sits on your Windows desktop and turns CPU, RAM, GPU, network, disk and battery readings into live tiles with graphs.

Buy for $3.99
One payment. No subscription.
14-day money-back guarantee.
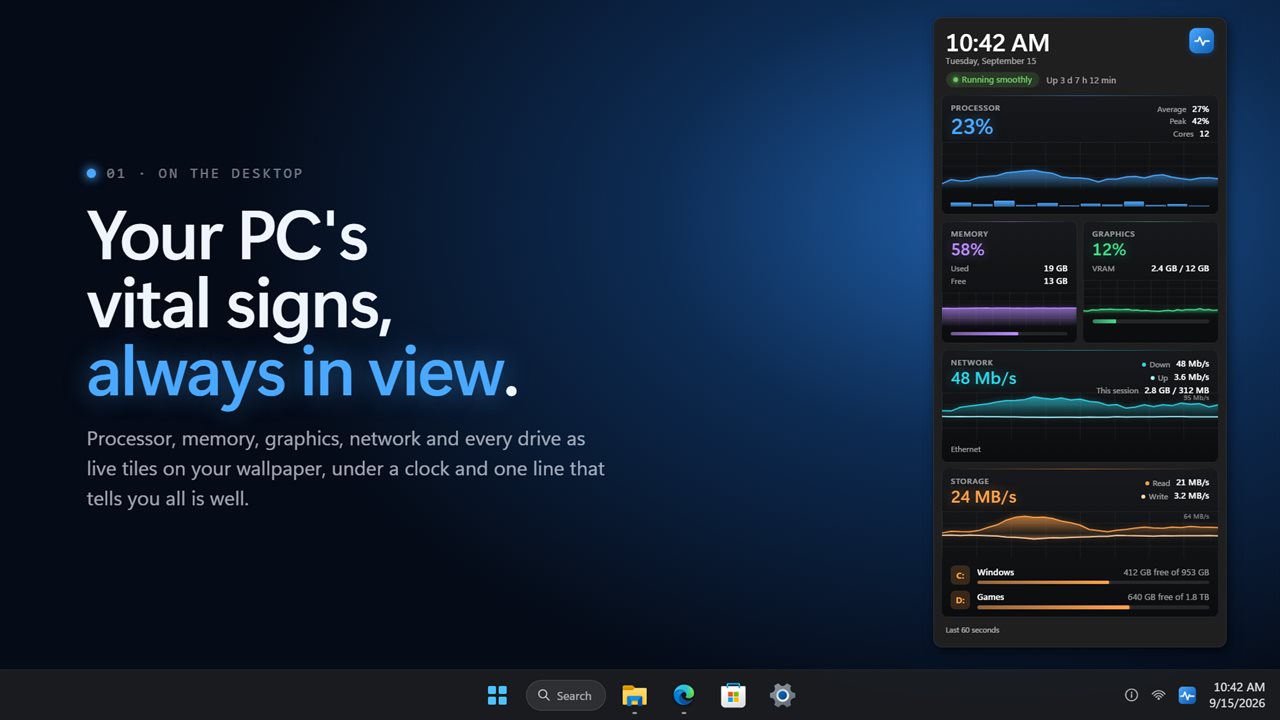
Your PC's vital signs, live on the desktop.
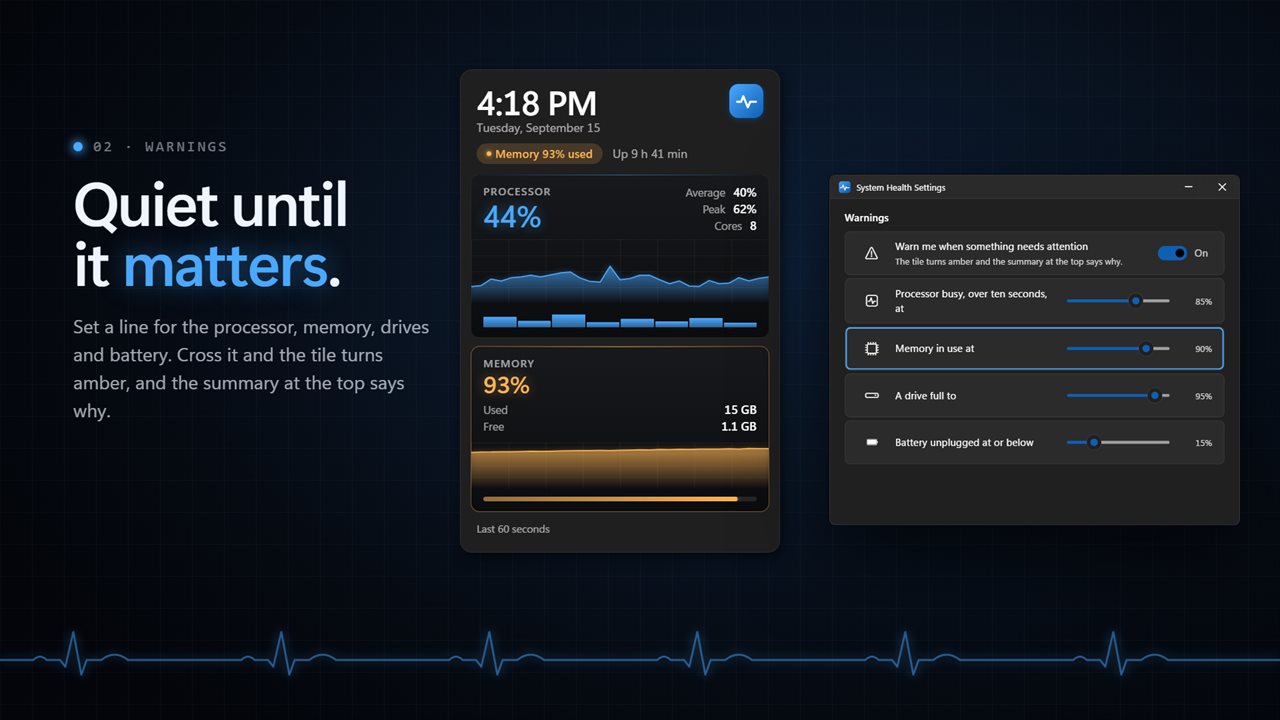
Set your own warning levels. Cross one and the tile turns amber, and the summary says why.
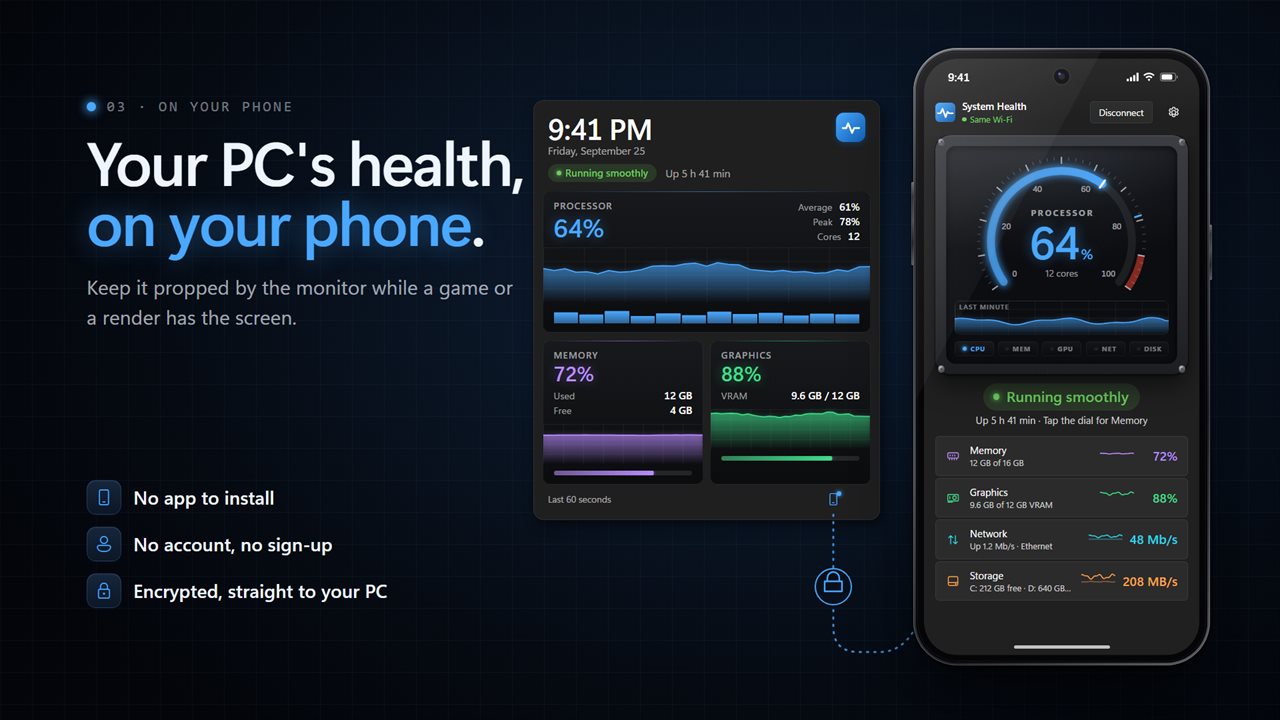
Watch it on your phone while a game or render has the screen. No app to install, no account, and an encrypted link straight to your PC.
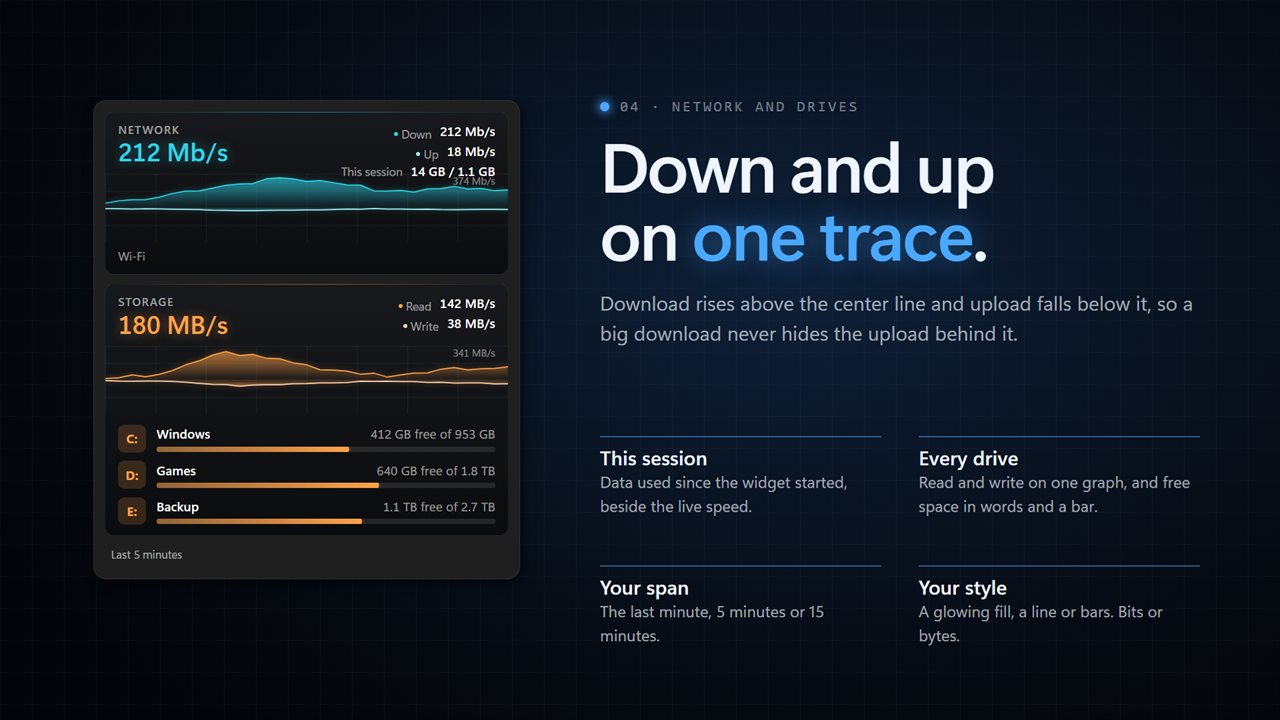
Download and upload on one mirrored graph, with session totals and free space for every drive.
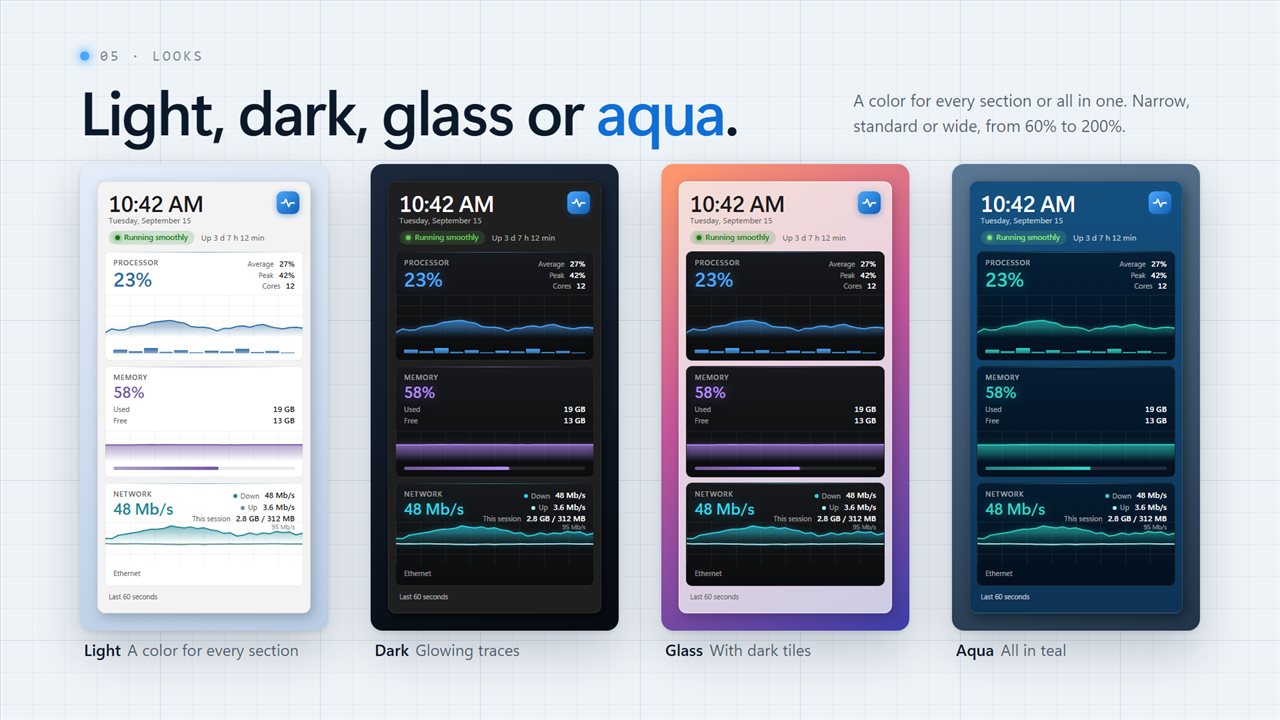
Light, dark, glass or aqua, with a color for every section or all in one.
No account, no sign-up, no ads. Starts with Windows if you want.

System Health Widget in 37 seconds

System Health Widget trailer
190,000+downloads of EvlarSoft apps
Signed by EvlarSoftVerified US publisher
14-day money-backNo questions asked
Updates includedNo upgrade fees

A system monitor widget that lives on the desktop

The CPU, GPU and memory cards Windows 11 offers live on the Widgets board, so you have to press Win + W to see them, and they disappear again when you click away. System Health is a system monitor widget that stays on the desktop itself, as a column of tiles you can read without opening anything.

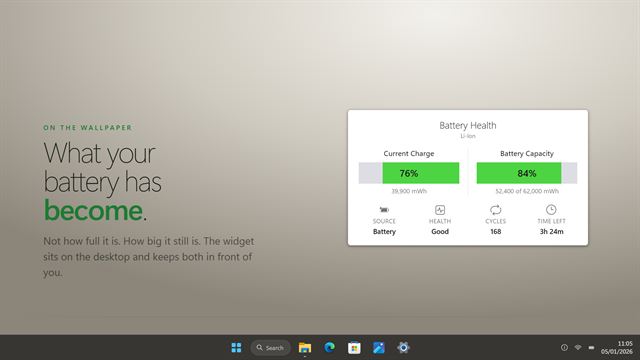
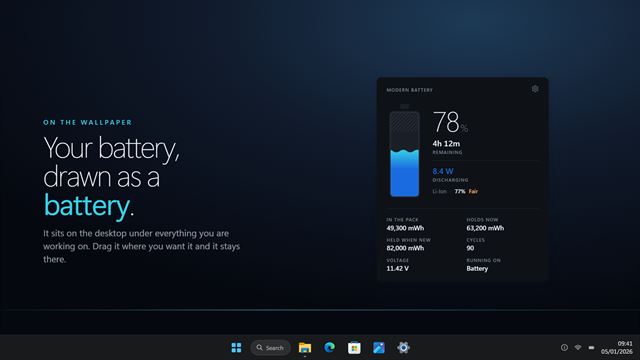
Every tile opens on a big number with its own graph underneath: processor load with its average, peak and a bar per core; memory used and free; GPU load plus VRAM for each graphics card that exposes it; network download and upload; drive read and write with free space per drive; and, on a laptop, battery charge, remaining runtime and wattage.

Across the top sits a clock with the date, the time since Windows started, and a single summary line. When everything is within your limits it reads Running smoothly. When something is not, it names it.

PC performance monitor with warnings you control

Warn me when something needs attention is on from the start, and under Warnings each tile gets a limit of your choosing. Cross a limit and that tile goes amber while the headline line names the reading and how far over it is. The defaults are 90 percent for processor, memory and drives, and 20 percent for an unplugged battery.

Right-click any tile and choose Open Task Manager to find the culprit straight away. The same menu has Move up, Move down and Hide for that tile, and clicking a tile's title folds it to a single line.

Monitor CPU and GPU usage from your phone

A full-screen game or a long render covers the desktop, which is exactly when you want to see the numbers. Click Show on your phone on the widget, scan the code it displays, and the same readings open in your phone's browser with a large gauge for the reading you choose. There is no phone app and no sign-in, and the widget shows Phone connected while the link is up.

How to customize the system stats widget

Everything is in Settings, grouped by what it changes.

  • The panel: Theme (Match Windows, Light or Dark), Finish (Solid, Glass or Aqua), an option for dark tiles on a pale panel, Colors, Width (Narrow, Standard, Wide) and a Size slider from 60 to 200 percent.
  • Across the top: turn the clock and summary, the time and date, or the time since Windows started on or off.
  • Graphs: a history window of one, five or fifteen minutes; Glowing fill, Line only or Bars; and an Update every setting from half a second up to five seconds.
  • Tiles: show or hide each one, choose bits or bytes for network speed, and keep a running count of data used since the widget started.
  • On the desktop: sit on the wallpaper or above other windows, and Start with Windows.
What the widget monitors

  • Processor load with average, peak and one bar per core
  • Memory in use and free, with a graph
  • Graphics load and VRAM per GPU, where the driver reports it
  • Network download and upload on a mirrored waveform, with session data totals
  • Drive read and write, plus free space for every drive
  • Battery charge, charging state, runtime left and wattage on laptops
  • Amber warnings, explained in one headline sentence
  • Clock, date and uptime header
  • Phone mirrorScan a code, and the readings open in a mobile browser
  • Open Task Manager from the right-click menu

Who it is for

Gamers and streamers

Keep CPU and GPU load on a phone beside the monitor while the game holds the screen.

People with a slow or noisy PC

The summary line points to the reading that is high, so you know whether memory, the processor or a full drive is the cause.

Anyone running long jobs

A fifteen-minute history shows whether an export, backup or compile is still working hard or has gone idle.

Questions

Anything else? Ask us

Can I watch my PC's readings on my phone?

Yes. Scan the code on the widget and the readings open in your phone's browser, with no app to install. The phone gets an update about once a second, over an encrypted link that goes directly across your network when it can.

Does it show CPU or GPU temperature?

No. It shows load, memory, video memory, network and drive speeds, free space and battery, but no temperatures.

Will it alert me when memory or the processor is running high?

Not with a pop-up. When a reading crosses the level you set, that tile turns amber and the line at the top says why, such as Memory 93% used. The processor counts as busy only when its average over the last ten seconds passes your level, so a short spike does not trigger it.

What warning levels can I set?

Processor from 50% to 100%, memory and drives from 50% to 99% full, and an unplugged battery from 5% to 50%. Removable drives do not trigger the drive warning, and warnings can be turned off while the figures stay.

Does it show every graphics card?

It shows load and video memory for each graphics adapter that reports them. If no adapter reports its load, the Graphics tile does not appear.

How often does it update, and how much history do the graphs show?

Every half second, second, 2 seconds or 5 seconds, with 1 second as the default. The graphs cover the last minute, 5 minutes or 15 minutes.

How do I put CPU and RAM usage on my desktop in Windows 11?

Run System Health and its tiles appear on the desktop with live processor and memory readings. Turn on Start with Windows in Settings so they are there after every restart.

Can I hide tiles I don't need?

Yes. Switch any tile off under Tiles in Settings, or right-click it and choose Hide. A tile that is switched off is not read at all.

Can the widget stay above full-screen windows?

Set Sits to Above other windows to keep it over ordinary windows. While a game fills the screen, the phone view is the way to keep watching.

Which versions of Windows does it run on?

Windows 10 (version 1809 or later) and Windows 11.

Is it a subscription?

No. System Health Widget is a one-time purchase of $3.99, and updates are included.

How do I get it?

Buy it on this page and your license key arrives by email. If the button says Notify me, System Health Widget is not on sale here yet; leave your email and we will tell you when it is.

Prefer widgets? The System Monitor widget on WidgetSpark does a similar job, alongside over 100 other desktop widgets in one app.